OUTLINE LESSONS 11a and 11b
Price and Output Determination: Monopolistic Competition &
Oligopoly
11a - MONOPOLISTIC COMPETITION
I. Introduction: The Product Markets
A. Circular Flow Model
B. Four Product Market Models1. Competitive Market (Lessons 8/9a, 8/9b)2. Monopoly (Lessons 10a, 10b)
3. Monopolistic Competition (Lesson 11a)
4. Oligopoly (Lesson 11b)
C. General Outline for Each Model
1. Characteristics and Examples
2. Nature of the Demand Curve
3. Short Run Equilibrium (Profit Max.)
4. Long Run Equilibrium and Efficiency
5. Other Issues
II. Definition: Monopolistic Competition
A market structure in which many firms sell a differentiated product into which entry is relatively easy in which the firm has some control over its product price and in which there is considerable nonprice competition.
III. Characteristics
A. NUMBER OF FIRMS: manyTherefore:1. Small market share (Small concentration ratio)
2. No collusion possible
A situation in which firms act together and in agreement (collude) to fix prices divide a market or otherwise restrict competition.3. Independent action (no mutual interdependence)
B. TYPE OF PRODUCT: differentiated
1. Definition: A strategy in which one firm’s product is distinguished from competing products by means of its design, related services, quality, location, or other attributes (except price).2. also called nonprice competition
distinguishing one’s product by means of product differentiation and then advertising the distinguished product to consumers.3. How?
a) product quality
b) services
c) location
d) brand names and packaging4. Effect of product differentiation: some control over price
5. Cost of product differentiation: need to advertise
C. CONTROL OVER PRICE:
1. within narrow limits2. little econ. power
D. EASE OF ENTRY: relatively easy entry
E. NONPRICE COMPETITION: very much
IV. Examples
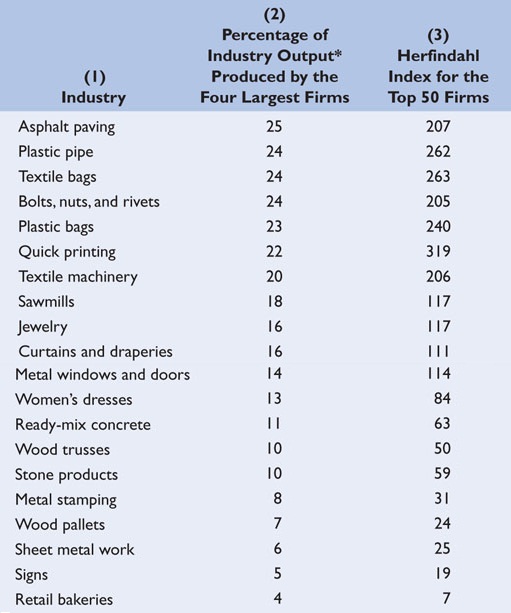
A. Concentration Ratio - lowThe percentage of the total sales of an industry made by the four (or some other number) largest sellers in the industry.B. Herfindahl Index - low
A measure of the concentration and competitiveness of an industry; calculated as the sum of the squared percentage market shares of the individual firms.SUM % market shares squared
If monopoly = 100 squared = 10,000If 4 firms with 25% each =
= 25 squared + 25 squared + 25 squared + 25 squared
= 2500if 100 firms with 1% each =
= SUM 1 squared + 1 squared + . . . . .
= 100
C. Examples
Percentage of Output Produced by Firms in Selected Low Concentration U.S. Manufacturing Industries
ALSO:retail establishments in metropolitan areas, such asgrocery stores
gas stations
barber shops
dry cleaners
clothing stores
restaurants
V. Price and Output Determination
A. Benefit-Cost Analysis - Review 2 Steps1. find Q where MR=MC2. produce Q only if AR>AVC
B. Demand and Monopolistic Competition
1. downsloping
2. quite price elastic - WHY?C. Three Short Run Cases
1. profit maximizing economic profits [graph]
2. loss minimizing (graphs)
3. shut down
D. Long Run Equilibrium
1. Few barriers to entry2. Therefore, tends toward normal profits
a. if profits: firms enterb. if losses: firms leave
c. Result: Normal Profits
d. but there are complications:
(1) Some firms may achieve a measure of differentiation that is not easily duplicated by rivals (brand names, location, etc.) and can realize economic profits in the long run.(2) There is some restriction to entry, such as financial barriers that exist for new small businesses, so economic profits may persist for existing firms.
(3) Long-run below-normal profits may persist, because producers like to maintain their way of life as entrepreneurs despite the low economic returns.
3. Long Run Equilibrium:
a. profit maximizing quantity (MR=MC) is Q1b. profit maximizing price is P4
 a. profit maximizing quantity (MR=MC) is Q3
b. profit maximizing price is P3
VI. Monopolistic Competition and Efficiency
A. Allocative Inefficiency1. At the profit maximizing quantity P>MCa) underallocation of resources:
b) but close with elastic demand
c) also, some utility gained from product differentiation2. only normal profits
3. see graph below
a. the allocative efficient quantity is: Q2 = WHAT WE WANT
b. the profit maximizing quantity is Q1 = WHAT WE GET
B. Productive Inefficiency
1. not minimum ATC (not where MC=ATC)2. excess capacity
Plant resources which are underused when imperfectly competitive firms produce less output than that associated with achieving minimum average total cost.3. also, advertising may increase costs without increasing utility (graph)
4. see graph below
the productively efficient quantity is Q3

I. Introduction: Four Product Market Models
A. Competitive Market (Lessons 8/9a, 8/9b)
B. Monopoly (Lessons 10a, 10b)
C. Monopolistic Competition (Lesson 11a)
D. Oligopoly (Lesson 11b)
II. Definition - Oligopoly
A market structure in which a few firms sell either a standardized or differentiated product into which entry is difficult in which the firm has limited control over product price because of mutual interdependence (except when there is collusion among firms) and in which there is typically nonprice competition.
III. Characteristics - Oligopoly
A. NUMBER OF FIRMS: few1. mutual interdependenceA situation in which a change in price strategy (or in some other strategy) by one firm will affect the sales and profits of another firm (or other firms); any firm which makes such a change can expect the other rivals to react to the change.2. collusion possible
A situation in which firms act together and in agreement (collude) to fix prices divide a market or otherwise restrict competition.B. TYPE OF PRODUCT:
homogenous OR differentiatedhomogeneous oligopoly - An oligopoly in which the firms produce a standardized product.differentiated oligopoly - An oligopoly in which the firms produce a differentiated product.
C. CONTROL OVER PRICE:
1. much if there is collusion2. limited by mutual interdependence
A situation in which a change in price strategy (or in some other strategy) by one firm will affect the sales and profits of another firm (or other firms);any firm which makes such a change can expect the other rivals to react to the change.
D. EASE OF ENTRY: significant obstacles or barriers to entry (from lesson 10a)
1. economies of scale: costsa) graphically
b) rationale
c) natural monopolies3. legal barriers
a) patents
b) licenses3. ownership of essential raw materials
4. pricing and other strategic barriers
E. NONPRICE COMPETITION: much with differentiated products
IV. Examples
Percentage of Output Produced by Firms in Selected High Concentration U.S. Manufacturing Industries
Also:
U.S Aluminum Industry
Auto Parts in Medium-size towns
"Big 4", "Big 3", etc.
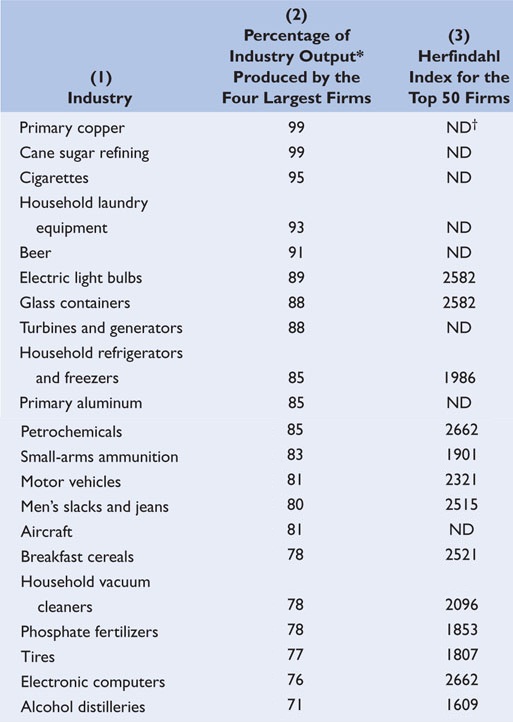
V. Measures of Industry Concentration
A. Concentration ratioThe four-firm concentration ratio gives the percentage of total industry sales accounted for by the four largest firmsB. The concentration ratio has several shortcomings in terms of measuring competitiveness.
1. Some markets are local rather than national, and a few firms may dominate within the regional market.2. Interindustry competition sometimes exists, so dominance in one industry may not mean that competition from substitutes is lacking.
3. World trade has increased competition, despite high domestic concentration ratios in some industries like the auto industry.
4. Concentration ratios fail to measure accurately the distribution of power among the leading firms.
5. Concentration tells us nothing about the actual market performance of various industries in terms of how vigorous the actual competition is among existing rivals.
C. The Herfindahl index
- A measure of the concentration and competitiveness of an industry or another way to measure market dominance.
- calculated as the sum of the squared percentage market shares of the individual firms.
- so that much larger weight is given to firms with high market shares.
- A high Herfindahl index number indicates a high degree of concentration in one or two firms.
- A high index might be where one firm has 80 percent of the industry and the others have 6 percent each for a total of 6400 + (6 squared x 3) = 6,508.
- A lower index might mean that the top four firms have rather equal shares of the market, for example, 25 percent each (25 squared x 4 = 2,500).
VI. Oligopoly Behavior: A Game-Theory Overview
A. Game theoryB. Mututal Interdependence Revisited
C. Collusion
D. Incentive to cheat
VII. Price and Output Determination
A. No Standard Model But Common Pricing Characteristics1. Why no common modela) diversity of specific market situationsb) collusion possible
A situation in which firms act together and in agreement (collude) to fix prices divide a market or otherwise restrict competition.c) mutual interdependence
A strategy in which one firm’s product is distinguished from competing products by means of its design, related services, quality, location, or other attributes (except price).2. Common pricing characteristics
a) prices tend to be inflexible
b) when prices do change, firms tend to change prices togetherB. Three Oligopoly Pricing Models
1. kinked demand: noncollusive oligopoly
2. collusion
3. price leadershipC. Kinked Demand: Noncollusive Oligopoly
1. Kinked Demand CurveIMPORTANT: based on the assumption that rivals will:- follow a price decrease, and- ignore a price increase.
2. demand and MR curve
a. if competitors IGNORE price increasesA firm will expect demand will be elastic (flatter) when it increases price.From the total-revenue test, we know raising prices when demand is elastic will decrease revenue.
So the noncolluding firm will not want to raise prices.
b. if competitors MATCH price decreases
The individual firms believe that rivals will match any price cuts.Therefore, each firm views its demand as inelastic (steeper) for price cuts,
which means they will not want to lower prices since total revenue falls when demand is inelastic and prices are lowered.
c. result:
e. lecture graph
3. price and output determination (see graph above)
a. profit maximizing quantity: 0gb. profit maximizing price: 0d
|
|
|
4. price inflexibility
a. This analysis shows how prices tend to be inflexible in oligopolistic industries.b. The figure above shows that marginal cost has substantial ability to increase at price P before it no longer equals MR; thus, changes in marginal cost will also not tend to affect price.
5. criticisms
a. There is no explanation of why P is the original price.b. In the real world oligopoly prices are often not rigid, especially in the upward direction.
6. Quick Quiz
7. Examples ?
8. optional: The Kinked Demand Model
D. Cartels and Other Collusion
Cartels and collusion agreements constitute another oligopoly model1. definition collusion2. examples
OPEC CartelCartel: A formal agreement among firms in an industry to set the price of a product and the outputs of the individual firms or to divide the market for the product geographically.
3. price and output determination
a. assumptions
b. joint profit maximization
c. graph
To maximize profits, the firms collude and agree to a certain price. Assuming the firms have identical cost, demand, and marginal-revenue date the result of collusion is as if the firms made up a single monopoly firm.
4. overt collusion: the OPEC cartelsA cartel is a group of producers that creates a formal written agreement specifying how much each member will produce and charge.The Organization of Petroleum Exporting Countries (OPEC) is the most significant international cartel.
5. covert collusion - tacit understanding
Cartels are illegal in the U.S., so any collusion here is secret, or covert.When firms reach verbal understandings with one another on product price - frequently through interaction on golf courses, cocktail parties, via phone, or at trade association meetings.
Historically, these understandings are referred to as Gentlemen's Agreements.
Tacit understandings are in violation of antitrust laws, but their elusive nature makes them difficult to detect.
Examples of these illegal, covert agreements include:
- the 1993 collusion between dairy companies convicted of rigging bids for milk products sold to schools-in 1996, American agribusiness Archer Daniels Midland, three Japanese firms, and a South Korean firm were found to have conspired to fix the worldwide price and sales volume of a livestock feed additive.
- electrical equipment conspiracy
- ND highway contractors
6. obstacles to collusion
a. Differing demand and cost conditions among firms in the industry;b. A large number of firms in the industry;
c. The temptation to cheat;
d. Recession and declining demand;
e. The attraction of potential entry of new firms if prices are too high; and
f. Antitrust laws that prohibit collusion.
E. Price Leadership
1. definitionAn informal method which firms in an oligopoly may employ to set the price of their product: one firm (the leader) is the first to announce a change in price and the other firms (the followers) soon announce identical or similar changes.2. Price leadership in oligopoly occasionally breaks down and sometimes results in a price war.
A recent example occurred in the breakfast cereal industry in which Kellogg had been the traditional price leader.3. Examples - current or recent
Farm Machinery
Cement
Copper
Newsprint
Glass Containers
Beer,
Fertilizer
Cigarettes
VII. Oligopoly and Efficiency
A. Allocative and Productive EfficiencyAllocative and productive efficiency are not realized because price will exceed marginal cost and, therefore, output will be less than minimum average-cost output level
1. Kinked Demand a. profit maximizing quantity: 0g
(where MR = MC, "what we get')b. allocatively efficient quantity: 0h
(where P = MC, "what we want')c. productively efficient quantity: minimum ATC
2. Collusion
 a. profit maximizing quantity: 0M
(where MR = MC, "what we get')b. allocatively efficient quantity: 0Q
(where P = MC, "what we want')c. productively efficient quantity: 0N
(minimum ATC)3. The economic inefficiency may be lessened because:
a. Foreign competition can make oligopolistic industries more competitive (efficient) on a global scale.b. Oligopolistic firms may keep prices lower (and more efficient) in the short run to deter entry of new firms.
c. Over time, oligopolistic industries may foster more rapid product development and greater improvement of production techniques than would be possible if they were purely competitive.
called Dynamic Efficiency
- they have the means = long run profits
- they have an incentive - barriers to entry protect profits
VIII. Oligopoly and Advertising
A. Product development and advertising campaigns are more difficult to combat and match than lower prices.B. Oligopolists have substantial financial resources with which to support advertising and product development.
C. Advertising can affect prices, competition, and efficiency both positively and negatively.
1. Advertising reduces a buyers’ search time and minimizes these costs. - GOOD2. By providing information about competing goods, advertising diminishes monopoly power, resulting in greater economic efficiency. - GOOD
3. By facilitating the introduction of new products, advertising speeds up technological progress. - GOOD
4. If advertising is successful in boosting demand, increased output may reduce long run average total cost, enabling firms to enjoy economies of scale. ( from a to b)
5. Not all effects of advertising are positive.
a. Much advertising is designed to manipulate rather than inform buyers.b. When advertising either leads to increased monopoly power, or is self-canceling, economic inefficiency results.