OUTLINE -- LESSONS 8/9a, 8/9b
Producer Decisions: Benefits (Pure Competition)
8/9a Pure Competition - Characteristics and Short Run
Equilibrium
I. Benefit-Cost Analysis and Producer Decisions
A. Decision: How Many to Produce:
B. Goal: Maximize Profits
C. Benefit Cost Analysis:all where: MB > MC
up to where: MB=MC
but never where: MB<MC
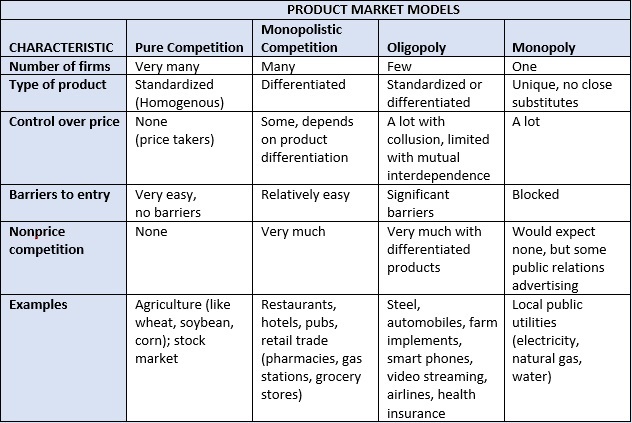
II. The Product Market
A. Circular Flow Model
B. Four Product Market Models1. Competitive Market (Lessons 8/9a, 8/9b)2. Monopoly (Lessons 10a, 10b)
3. Monopolistic Competition (Lesson 11a)
4. Oligopoly (Lesson 11b)
C. General Outline for Each Model1. Characteristics and Examples
2. Nature of the Demand Curve
3. Short Run Equilibrium (Profit Max.)
4. Long Run Equilibrium and Efficiency
5. Other Issues
III. Pure Competition.
A. DefinitionA market structure in which a very large number of firms sell a standardized product into which entry is very easy in which the individual seller has no control over the product price and in which there is no nonprice competition; a market characterized by a very large number of buyers and sellers.B. Characteristics of Competitive Markets
1. NUMBER OF FIRMS: very large numbers2. TYPE OF PRODUCT: standardized product
3. CONTROL OVER PRICE: "price takers"
A seller (or buyer) of a product or resource who is unable to affect the price at which a product or resource sells by changing the amount it sells (or buys).4. EASE OF ENTRY: free entry
5. NONPRICE COMPETITION: none
C. Examples / Relevance
1. applying benefit cost analysis
2. competitive markets used as the "standard" of efficiency
3. agricultureD. Demand and Competitive Markets
1. demand faced by the firm is perfectly elastic
2. market demand is downsloping
IV. Short Run Profit Maximization: Benefit-Cost Analysis Approach
A. Benefit-Cost Analysis1. definitionthe selection of ALL possible alternatives where the marginal benefits are greater than the marginal costselect all where: MB > MC
up to where: MB = MC
but never where: MB < MC2. marginal costs = MC (ch. 7)
3. What are the MBs of selling one more unit of output?marginal benefits = marginal revenue (MR)a) total revenue (TR = P x Q)
b) MR =TR /
B. Profit Maximization -- Applying Benefit-Cost Analysis
1. step 1: find best quantity (where MR = MC)
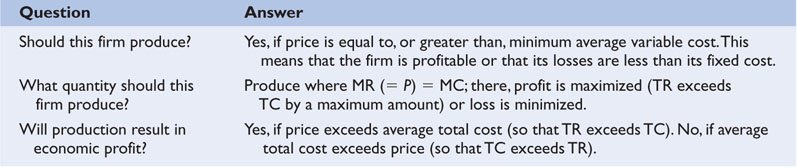
2. step 2: are AR > AVC? If yes, then produce this quantity
3. calculate profitsa) profits = TR - TC
b) check to see if profits are maximized
How to find the profit maximizing quantity:A firm will maximize its profit (or minimize its losses) by producing that output at which marginal revenue and marginal cost are equal provided product price is equal to or greater than average variable cost |
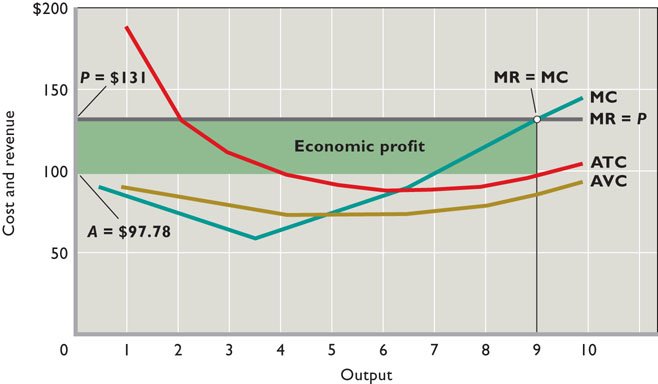
C. Three Cases -- using BOTH cost schedules and graphs1. profit maximizing casea) step 1: find quantity where MR = MCb) step 2: are AR > AVC? If yes, then produce this quantity
c) calculate profits
d) textbook graph, table, graph
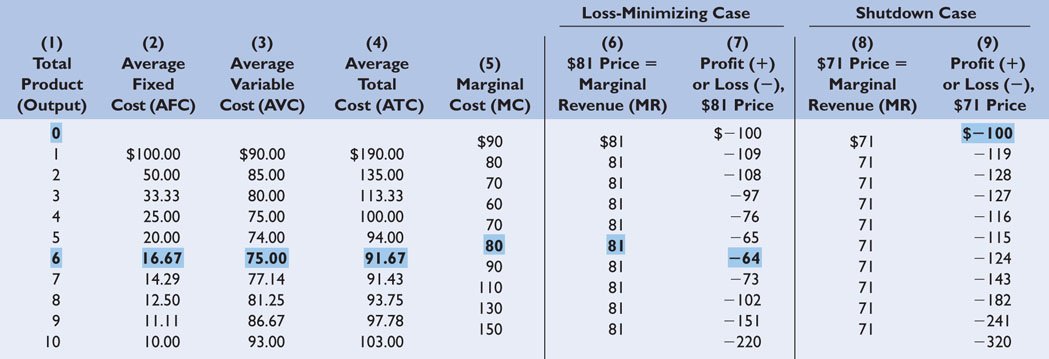
2. loss minimizing casea) step : find quantity where MR = MC
b) step 2: are AR > AVC? If yes, then produce this quantity
c) calculate profits
d) check to see if losses are minimized
e) why not close down?
f) graph, table3. shutdown case
a) step 1: find quantity where MR = MC
b) step 2: are AR > AVC? If yes, then produce this quantity
c) calculate profits/check
d) graph, table
D. Marginal Cost and the Short Run Supply Curve
- A supply curve which shows the quantity of a product a firm in a purely competitive industry will offer to sell at various prices in the short run;
- the portion of the firm’s short-run marginal cost curve which lies above its average variable cost curve.
V. Profit Maximization: total cost minus total revenue approach
A. Short Run
B. Graph
8/9b Pure Competition - Long Run
Equilibrium and Efficiency
VI. Pure competition in the Long Run
A. AssumptionsB. LR Equilibrium: competitive markets
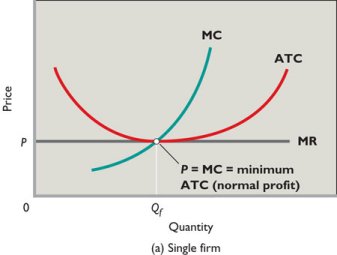
1. "After all long-run adjustments are completed, product price will be exactly equal to, and production will occur at, each firm's point of minimum average total cost"
2. zero profit (normal profit) modelC. Why?
1. entry of firms eliminates profits
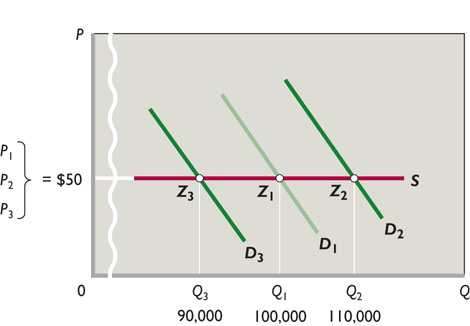
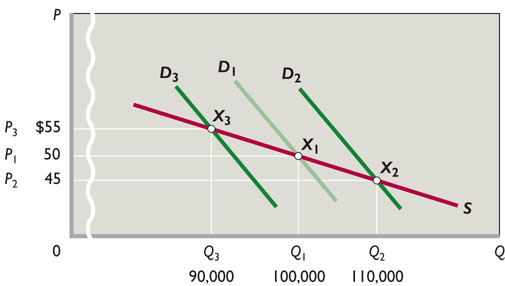
From the Textbook: IF DEMAND INCREASES, PRICE WILL INCREASE NEW FIRMS WILL ENTER AND PRICE WILL FALL BACK TO WHERE IT WAS
2. exodus of firms eliminates losses
From the Textbook: IF DEMAND DECREASES, PRICE WILL DECREASE FIRMS WILL GO OUT OF BUSINESS AND PRICE WILL RISE BACK TO WHERE IT WAS
D. Pure competition: Long-run equilibrium graph
F. Long Run Supply Curve
A schedule or curve showing the prices at which a purely competitive industry will make various quantities of the product available in the long run.1. constant cost industry
An industry in which expansion or contraction will not affect resource prices and therefore production costsGraphically, it means the entry or exit of firms does not shift the long-run ATC curves of individual firms
Occurs when the industry's demand for resources is small in relation to the total demand for those resources
2. increasing cost industry
An industry in which expansion through the entry of new firms, because of an increase in demand, increases the prices firms in the industry must pay for resources and therefore increases their production costs.Occurs when the industry's demand for resources is large in relation to the total demand for those resources
3. decreasing cost industry
An industry in which expansion through the entry of firms, because of an increase in demand, decreases the prices firms in the industry must pay for resources and therefore decreases their production costs.Occurs when the industry's demand for resources allows its resource providers to take advantage of economiews of scale.
VII. Pure Competition and Efficiency !!!!!!!!!!!!!!!!
A. Competitive Markets Used as Standard of Efficiency -- The "Invisible Hand" of Capitalism
- "The invisible hand" (introduced in Lesson 2a) works in a competitive market system
- businesses are just trying to maximize their profits
- but the result is Allocative Efficiency
1. Pure competition achieve Productive Efficiency
2. Pure competition achieves Allocative Efficiency
3. Purely competitive firms will be X-efficient
4. Purely competitive firms are not Dynamically EfficientB. Purely competitive firms achieve Productive Efficiency
1. definition
- The production of a good in the least costly way or producing at a minimum cost
- Producing at a minimum cost
2. P = minimum ATC or MC=ATC (because MC crosses ATC at the minimum ATC)
- productive efficiency occurs when production takes place at the output at which average total cost is a minimum
- this is where the MC curve crosses the ATC (on the graph: MC=ATC)
3. Pure competition: Long-run equilibrium graph
How to find the productively efficient quantity:Society will achieve productive efficiency by producing that output at which the average total cost (ATC) is at a minimum |
C. Purely competitive firms achieve Allocative Efficiency1. definitionThe apportionment of resources among firms and industries to obtain the production of the products most wanted by society (consumers);2. MSB = MSC
( To review MSB, MSC and Efficiency see supply, demand, and economic efficiency from lesson 3c)3. The allocatively efficient quantity: P = MC
Allocative efficiency is achieved at the output of each product at which its marginal cost and price or marginal benefit are equal (P = MC).a. MSB = P (if there are no positive externalities)
b. MSC = MC (if there are no negative externalities
c. Therefore: MSB = MSC where P = MC
How to find the allocatively efficient quantity:
Society will achieve allocative efficiency by producing that output at which price and marginal cost are equalP=MC
4. Pure competition: Long-run equilibrium graph
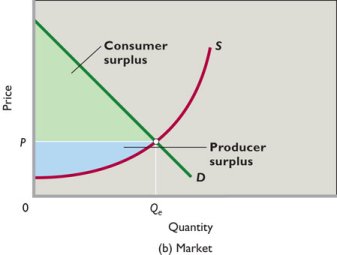
5. Maximizing producer and consumer surplus = allocative efficiency
- Where P=MC the producer and consumer surpluses are maximized
6. allocative INefficiency
a. underallocation of resources: P > MC
- Q1 on graph below
- too little is being produced
- we would get more utility from more of this product than we would from our next best alternative
b. overallocation of resources: P < MC
- Q2 on graph below
- too much is being produced
- we would get less utility from more of this product than we would from our next best alternative
5. marginal cost pricing
To achieve allocative efficiency: MSB should equal MSCIf P measures MSB and MC measure MSC then to achieve allocative efficiency:
P should equal MCEXAMPLES - see below
D. Purely competitive Firms must be X-efficient
- X-inefficiency occurs when the production of output, whatever its level, at a higher average (and total) cost than is necessary for producing that level of output.
- in other words, the ATC curve can be lower than it is
- if acompetitive firm has a higher ATC curve than its competitiors then they will earn losses and go out of business
E. Purely Competitive Firms are NOT Dynamcially Efficient
- So far in the long run analysis of pure competition, we assumed that entry/exit of firms is merely a reaction to price and that all firms produce the same products at the same costs and all firms earn a normal profit
- But firms want a higher than normal profit - they want an economic profit
- They can earn above normal profits by the creation of new goods (higher demand) and finding new production technologies to lower costs.
- A firm can create an entirely new, popular good and as the only producer of this good the firm will have control over the price and make more than a normal profit. (Pure Monopoly is covered in Lessons 10a and 10b)
- Since firms in pure competition lack the ability to change the market price, they seek to improve production technologies, lowering costs and increasing profits
- BUT:
- LACK INCENTIVE: No matter how the firm manages to increase his profits, usually these are temporary profits, because new firms can enter and copy what they are doing.
- LACK MEANS: Also, with only normal profits, they may not have the funds to conduct the necessary research
- Creative Destruction
- Creation of new goods and production techniques destroys market shares of firms committed to old goods and old business methods.
- Even the mere threat of new goods and technologies can cause existing firms to abandon their old ways.
- There are many examples of creative destruction in transportation, entertainment, music, postal service, and retail industries.
- in the 1800s railroads put horse drawn wagons out of business, later trucks took business from the trains
- movies challenged live theater, television challenged movie theaters, the internet is challenging television
- cassettes challenged records, CDs challenged cassettes, music downloads challenged CDs
- As creative destruction evolves an industry, individuals will likely become unemployed (at least temporarily) so there are costs even though the benefits are greater.
F. Marginal Cost Pricing
To achieve allocative efficiency: MSB should equal MSCIf P measures MSB and MC measure MSC then to achieve allocative efficiency:
P should equal MCEXAMPLES - see below
1. all you can eat / free refills
- what are the MSC to society (MC to the firm) of having one more?
- what is the price (P) to the consumer of having one more?
- does P=MC (or MSB=MSC) ?
- if not, is P>MC or is P< MC ?
- is allocative efficiency achieved? - or is there an OVER- or UNDER-allocation of resources?
2. electricity rates
- summer vs. winter
- when is the MC higher?
- therefore, to achieve allocative efficiency, when should the price be higher?
- if the price is not higher what might happen?
- days vs. evening (making snow only at night - why?)
- Why do they only make snow at night?
- when is the MC lower?
- therefore, to achieve allocative efficiency, when should the price be lower?
3. plane fares
- what is the MC of adding one more traveler to a plane that is half full?
- what is the MC of adding one more traveler to a plane is is full?
- Why do they charge less for "standby"?
- Is this efficient?
4. rent with utilities included
- what are the MSC to society (MC to the firm) of turning the heat up in the winter?
- what is the price (P) to the consumer of turning the heat up in the winter?
- does P=MC (or MSB=MSC) ?
- if not, is P>MC or is P< MC ?
- is allocative efficiency achieved or is there an OVER- or UNDER-allocation of resources?
5. bus fares
- when is the cost (MC) to the bus company, or the cost to society (MSC), greater?
- at rush hour ?
- or at noon hour ?
- when should the price be higher to achieve allocative efficiency?
6. parking meters
- when is the cost to society (MSC) of allowing one more person to park greater?
- week days when there are few or no available parking spaces?
- weekends when there are many available parking spaces?
- when should the price be higher to achieve allocative efficiency?
- what should the price be on weekends to be allocatively efficient assuming that there are very many empty parking spaces available?
7. garbage collection and recycling
8. tollway fares
- when is the cost to society (MSC) of allowing one more car on the tollway greater?
- rush hour when there is a lot of traffic?
- noon hour when there is very little traffic?
- when should the price be higher to achieve allocative efficiency?
- how does this save resources?
9. congestion tolls for London and New York
10. negative externalities and positive externalities (spillover costs and benefits) (see lessons 5a and 5b)
11. other
VIII. Advantages and Disadvantages of the Competitive Price System
[From: http://www.economicshelp.org/microessays/markets/efficiency-pc.html]A. ADVANTAGES
1. Allocative Efficient. This is because P = MC2. Productive Efficient. This is because firms produce at the lowest point on the AC
3. X - Efficient. Competition between firms will keep their ATC as low as possible.
4. Resources will not be wasted through advertising because products are homogenous
5. Normal profit means consumers are getting the lowest price. This also leads to greater equality (or equity) in society
B. DISADVANTAGES
1. No scope for economies of scale, this is because there are many small firms producing relatively small amounts. Industries with high fixed costs would be particularly unsuitable to perfect competition (like natural monopolies). This is one reason why pure competition is unlikely in the real world2. Undifferentiated products are boring, giving little choice to consumers. Differentiated products are very important in industries such as clothing and cars = narrow range of Consumer Choice
3. Dynamically inefficient:
a. LACK MEANS: Lack of supernormal profit may make investment in R&D unlikely this would be important in an industry such as pharmaceuticals which require significant investment.b. LACK INCENTIVE: With perfect knowledge there is no incentive to develop new technology because it would be shared with other companies
4. With public goods, or if there are externalities in production or consumption, there is likely to be market failure without government intervention and allocative inefficiency will result