CHAPTERS
10 and 13
Fiscal Policy
10a The Spending Multiplier
|
I.
Introduction
A. Review : Fiscal
Policy
1. Definition:
discretionary
fiscal policy
Deliberate
changes in taxes (tax rates) and government spending by
Congress to promote full-employment, price stability, and
economic growth.
2. Fiscal Policy
tools
a. government
purchases (spending)
b. taxes
c. both
3. Expansionary Fiscal
Policy
- An
increase in government expenditures for goods and services,
- a
decrease in taxes,
- or some
combination of the two
- for the
purpose of increasing aggregate demand and expanding real
output
- this
will reduce UE
4. Contractionary Fiscal
Policy
- a
decrease in government expenditures for goods and services,
- an
increase in net taxes,
- or some
combination of the two
- for the
purpose of decreasing aggregate demand and thus controlling
inflation.
FISCAL
POLICY
WE
ALREADY KNOW:
If
there is UE?
- increase
G
- decrease
T
- both
If
there is IN?
- decrease
G
- increase
T
- both
|
NOW WE
ARE GOING TO LEARN:

B. HOW MUCH Should the
Government Change G or T?
1. We know that: GDP =
C + Ig + G + Xn
a.
Assume:
1. equilibrium
GDP = $400 billion
2. full employment GDP = $500 billion
b. What change in G is
needed to achieve full employment?
c. graph
2. RESULT: Multiplier
effect
II. The
Multiplier Effect
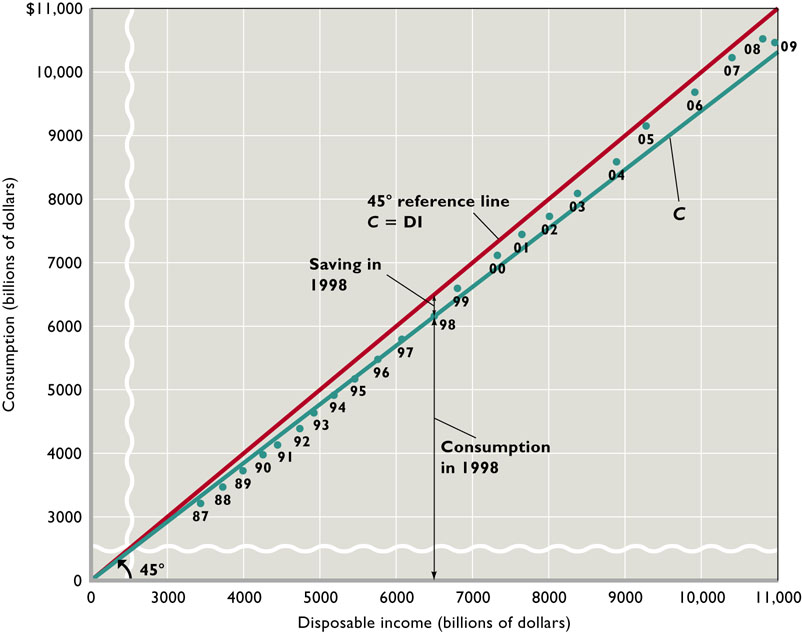
A. Consumption (C) and
Saving (S)
1.
introduction
a. DI = C + S
(ignoring taxes and imports)
b. the income
consumption-relationship (yellow page)
c. the income-saving
relationship (yellow page)
2. consumption and saving
schedules
a.
consumption schedule
1)
A schedule showing the amounts households plan to spend
for consumer goods at different levels of disposable
income.
2) average propensity
to consume (APC)
a)
definition
Fraction
(or percentage) of disposable income which households
plan to spend for consumer goods and services;
consumption divided by disposable income
b)
formula
b.
saving
schedule
1)
A schedule which shows the amounts households plan to
save (plan not to spend for consumer goods), at different
levels of disposable income.
2) saving and
dissaving
3) average propensity
to save (APS)
a)
definition
Fraction
(or percentage) of disposable income which
households save; saving divided by disposable
income.
b)
formula
c) APC + APS =
1
c. marginal propensity to
consume (MPC)
1)
definition
- The
fraction of any change in disposable income spent for
consumer goods;
- Equal
to the change in consumption divided by the change in
disposable income.
2)
formula
|
|
change
in C
|
|
MPC
=
|
-----------
|
|
|
change
in income
|
d. marginal propensity to
save (MPS)
1)
definition
- The
fraction of any change in disposable income which
households save;
- Equal
to the change in saving divided by the change in
disposable income.
2)
formula
|
|
change
in S
|
|
MPS
=
|
---------------
|
|
|
change
in income
|
3) MPC +MPS =
1
3. MPC and MPS
graphically
a. MPC = slope of
consumption function
|
|
change in
C
|
|
rise
|
|
|
|
MPC =
|
-----------
|
=
|
------
|
=
|
slope of
C
|
|
|
change in
income
|
|
run
|
|
|
Using the graph
above:
|
|
change in
C
|
|
80
|
|
|
|
MPC =
|
-----------
|
=
|
------
|
=
|
0.8
|
|
|
change in
income
|
|
100
|
|
|
b. MPS = slope of saving
function
|
|
change in
S
|
|
rise
|
|
|
|
MPS =
|
---------------
|
=
|
------
|
=
|
slope of S
|
|
|
change in
income
|
|
run
|
|
|
Using
the graph above:
|
|
change in
S
|
|
40
|
|
|
|
MPS =
|
---------------
|
=
|
------
|
=
|
0.2
|
|
|
change in
income
|
|
200
|
|
|
d. Are MPC and MPS really
constant - Are the consumption function and saving
function really straight lines?
NO - but it makes
calculations easier.
B Changing AD and The
Multiplier Effect assuming No Inflation
1. Definition:
Multiplier
The ratio of a
change in the equilibrium GDP to the change in investment or in
any other component of aggregate expenditures or aggregate
demand;
The number by
which a change in any component of aggregate expenditures or
aggregate demand must be multiplied to find the resulting
change in the equilibrium GDP.
2.  GDP
= initial spending x multiplier
GDP
= initial spending x multiplier
|
|
change in real
GDP
|
1
|
1
|
|
3. multiplier
=
|
-----------------------------------
|
= -------------------
|
= ------------------
|
|
|
initial change in
spending
|
MPS
|
1 - MPC
|
4. rationale -- how does the
multiplier work?
a. THIS IS
IMPORTANT!
(Be sure you understand figure 10.8: table
and
figure)
b. $20 billion bill in
class example (KNOW THIS!)
Assume: MPC = .8, and I increases by $20
billion
c. the multiplier and the
AS/AD graph: $20 billion bill in class
example
FROM TEXTBOOK (13.1)
d.
Does the multiplier work in reverse (if there is a decrease
in AD)? See: artbuchwaldmultiplier.htm
5. multiplier and marginal
propensities (slopes)
|
|
1
|
|
a. multiplier
=
|
-------
|
|
|
MPS
|
|
|
1
|
|
b. multiplier
=
|
------------
|
|
|
1 -
MPC
|
c. a larger MPC (or
smaller MPS) has a larger multiplier
6. The
Complex Multiplier (or the ACTUAL multiplier)
[REVIEW
MULTIPLIERS]
a. The Income =
Expenditures Stream (income becomes spending or
AD)

b. What ELSE can you do
with your Disposable Income (DI) besides spend
it?
- you can save it
- saving is a
"leakage" from the income = expenditure stream
- this creates the
simple multiplier
- you can also use it
to pay taxes (another "leakage" from the
income=expenditure stream )
- you can also spend it
on imports (another "leakage" from the income=expenditure
stream )
- so not all increases
in income become additional spending or
saving
- How does this affect
the size of the multiplier?
|
DI
|
|

|
C
|
|
|
AD
|
|
|

|
Leakages
|
|
Injections
|

|
|
|
|
|
S
|
|
I
|
|
|
|
|
|
T
|
|
G
|
|
|
|
|
|
M
|
|
X
|
|
|
c. If there are more
leakages, the multiplier is smaller
|
|
1
|
|
actual
multiplier =
|
-------------
|
|
|
leakages
|
d.
|
|
1
|
|
complex
multiplier =
|
-------------
|
|
|
MPS + MPT +
MPM
|
e. The Complex Multiplier
is SMALLER than the Simple Multiplier because there are more
leakages
(more is "torn" off
before additional income is spent).
III. Fiscal
Policy
Deliberate changes
in taxes (tax rates) and government spending by Congress to promote
full-employment, price stability, and economic growth.
A. Fiscal Policy and
Multipliers
REVIEW
MULTIPLIERS
1. G
and the multiplier
- we'll use the SIMPLE
multiplier
- simple multiplier =
1/MPS
2. T
and the multiplier
- we'll use the
lump-sum tax multiplier
a. lump-sum
tax
A
tax which is a constant amount (the tax revenue of
government is the same) at all levels of GDP.
b. the
lump-sum tax multiplier
1)
is always one less than the simple multiplier, but
negative ( =
simple multiplier - 1)
2)
lump-sum tax multiplier = -MPC / MPS
3. G
AND T
and the Multiplier
a. 's
in G AND 's
in T can be used in combination
b. "balanced budget"
multiplier = 1
- what happens to the
governmet's budget if they use expansionary
FP?
- What
if the government changes both G and T by the same amount
and in the same direction? Will GDP change?
- increase
G increase GDP, but HOW MUCH?
- increase
T decreases GDP, but HOW MUCH?
- The
'balanced budget multiplier" always has a value of 1
since the tax multiplier is always one less than the
government spending multiplier
V. Built-in
Stability
A. When the economy
enters a recession the government could:
- use expasionary FP
(discretionary FP)
- do NOTHING
(nondiscretionary FP)
B. What if the economy enters a
recession and the government does NOTHING what
happens?
- If Taxes are directly
related to GDP (income),
- and Transfer Payments
(welfare) are indirectly related to GDP,
- what happens to AD after
entering a recession?
- taxes
decrease
- government spending on
welfare increases
- so AD increases even
though the government did nothing
C. Built-in
Stabilizer
A
mechanism which increases government’s budget deficit (or
reduces its surplus) during a recession and increases
government’s budget surplus (or reduces its deficit)
during inflation without any action by policy makers;
the tax
system is one such mechanism.
D. Tax
Progressivity
- A tax
system wherein the average tax rate (tax revenue/GDP) rises
with GDP.
- The more
progressive the tax system, the greater the economy's built-in
stability.
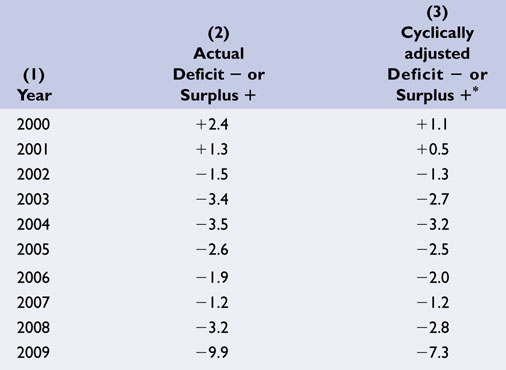
IV. Evaluating Fiscal Policy:
Cyclically-Adjusted Budget (also called the Full-Employment or
Standardized Budget)
What happens to the government budget
deficit if it uses expansionary FP?
What happens to the government budget deficit if the
economy enters a recession and the government does
NOTHING?
So, if the government budget deficit increases when the
economy enters a recession, does this indicate that the
government is doing some SOMETHING (expansionary FP) or
NOTHING?
Since deficits increase during recessions whether the
government does SOMETHING or NOTHING we cannot use larger
deficits as an indicator that the government is doing
something.
Therefore,
economists have created a the concept of a "full employment
budget"
|
An increase in the cyclically adjusted
(standardized or full-employment) budget
deficit is an
indicator of discretionary expansionary FP
|
- actual
budget
A
listing of amounts spent by the Federal government (to
purchase goods and services and for transfer payments) and
the amounts of tax revenue collected by it in any (fiscal)
year.
- cyclical
deficit
A
Federal budget deficit which is caused by a recession and
the consequent decline in tax revenues.
GRAPH
-
cyclically-adjusted (full-employment or standardized)
budget
A
comparison of the government expenditures and tax
collections which WOULD occur if the economy operated at
full employment throughout the year.
GRAPH
- structural
deficit
The
extent to which the Federal government’s expenditures
exceed its tax revenues when the economy is at full
employment (or the extent to which its current expenditures
exceed the projected tax revenues which would accrue if the
economy were at full employment); also known as a
full-employment budget deficit.
V. Problems,
Criticisms, and Complications
A. Problems of
Timing
1. RECOGNITION LAG is
the elapsed time between the beginning of recession or
inflation and awareness of this occurrence.
2. ADMINISTRATIVE LAG is the
difficulty in changing policy once the problem has been
recognized.
3. OPERATIONAL LAG is the
time elapsed between change in policy and its impact on the
economy.
B. Political
Considerations:
Government has other goals besides economic stability, and these
may conflict with stabilization policy.
1. A political
business cycle may destabilize the economy:
Election years have
been characterized by more expansionary policies regardless
of economic conditions. Some call this a political business
cycle:
The
alleged tendency of Congress to destabilize the economy by
reducing taxes and increasing government expenditures before
elections and to raise taxes and lower expenditures after
elections.
2. State and local finance
policies may offset federal stabilization policies.
They are often
procyclical, because balanced-budget requirements cause
states and local governments to raise taxes in a recession
or cut spending making the recession possibly
worse.
In an inflationary
period, they may increase spending or cut taxes as their
budgets head for surplus.
3. The crowding-out effect
may be caused by fiscal policy.
a.
REVIEW
MULTIPLIERS
b. DEFINITION: Crowding
Out Effect
A
rise in interest rates and a resulting decrease in
planned investment caused by the Federal
government’s increased borrowing in the money
market.
c. "Crowding-out" may
occur with government deficit spending.
It may increase
the interest rate and reduce private spending which
weakens or cancels the stimulus of fiscal
policy.
d. Some economists argue
that little crowding out will occur during a
recession.
e. Economists agree that
government deficits should not occur at FE.,
f. it is also argued that
monetary authorities could counteract the crowding-out by
increasing the money supply to accommodate the expansionary
fiscal policy.
VII. Supply-Side Fiscal Policy and
the Multiplier
A. What is "Supply-Side
FP" ?
1. The
contention that tax reductions will shift the aggregate supply
curve to the right.
(see the graph
below).
2. There are
three main reasons for this:
a.
Saving and investment - lower taxes will increase disposable
incomes, thereby increasing household savings, lowering
interest rates, and increase investment in new
technology
b. Work
incentives – lower tax rates will increase after tax
wages from work, thereby increasing work incentives and
productivity,
therefore, shift supply to the right.,
c. Risk
Taking – lower tax rates prod risk taking individuals
and businesses to risk their energy and financial capital on
new production methods and new products
and, therefore,
shift supply to the right.
B. Effect on the
multiplier - REVIEW
MULTIPLIERS
Larger multiplier:
instead of going from Q1 to Q2 (simple multiplier) the economy
goes to Q3
C. Supply side
economists sometimes argue that if lower taxes raise GDP, tax
revenues may actually rise.
Laffer
Curve
D. Many economists are
skeptical of supply-side theories.
1. Effect of lower
taxes on a supply is not supported by evidence.
2. Tax impact on supply
takes extended time, but demand impact is more
immediate.
13b Other Fiscal Policy Issues and Government Debt
|
VIII. Other FP Issues
A. Policy in the Great Depression (see videos)
B. New Keynesian and New Classical FP (see videos)
B. Government Budget Deficits and Trade (see videos)
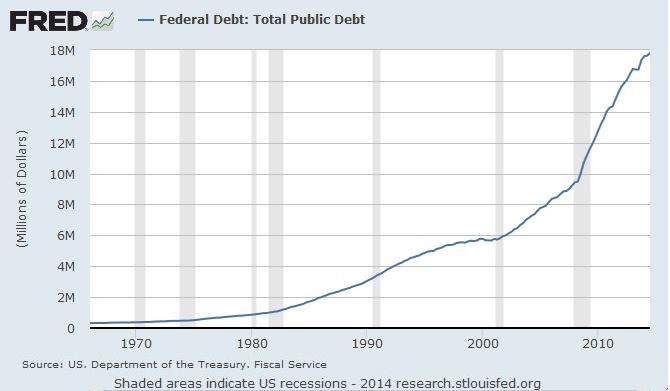
IX. The U.S. Public Debt
A. Introduction
1. OPTIONAL
CNN Deficit and Dept Quiz (2011):
http://money.cnn.com/quizzes/2010/news/fiscal-debt/index.html
2. Debt vs. Deficit
a. The national or public debt is the TOTAL
accumulation of the Federal government's total deficits and
surpluses that have occurred through time.
b. The federal government's budget DEFICITS and
SURPLUSES are ANNUAL differences between the revenue
collected and government spending.
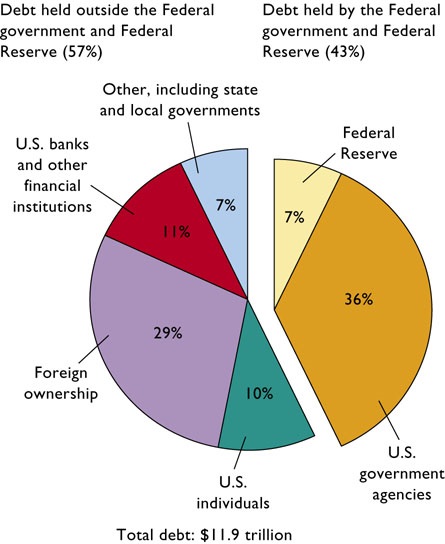
3. Size of the debt: TOTAL DEBT
a. $7.96 trillion in 2005.
b. $ 11.9 trillion in 2009
c. $16.4 trillion in 2012
B. Ownership of the public debt
1. Debt Held by the Public – all federal debt
held by individuals, corporations, state or local governments,
foreign governments and other entities outside of the United
States government.
2012: 60% of total debt
- 33% foreign owned (China owns about a quarter, Japan
a fifth)
- 10% owned by banks,etc.
- 6% owned by US individuals
- 11% Other including state and local
governments
2. Intragovernmental Holdings – government
securities held by government trust funds, such as the Social
Security trust fund and the Medicare trust fund, and the
Federal Reserve.
2012: 40%
- 29% US government agencies
- 11% Federal Reserve
2009
3. International comparison
https://www.cia.gov/library/publications/the-world-factbook/rankorder/2186rank.html
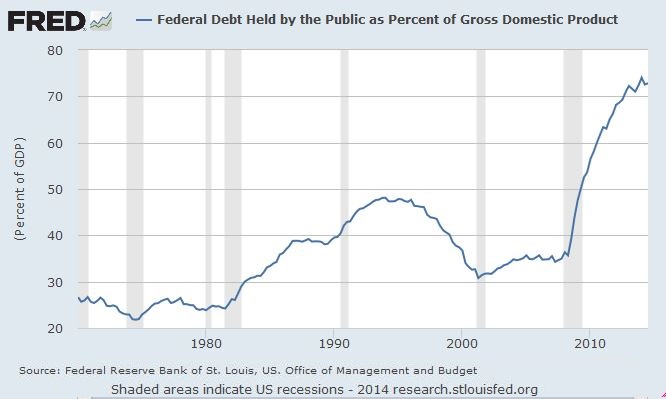
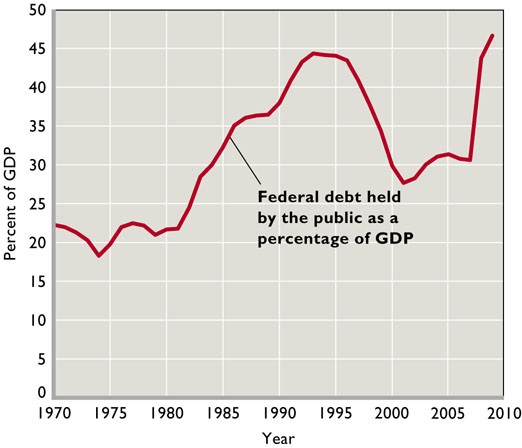
C. Debt and GDP
1. Debt: TOTAL vs. % GDP
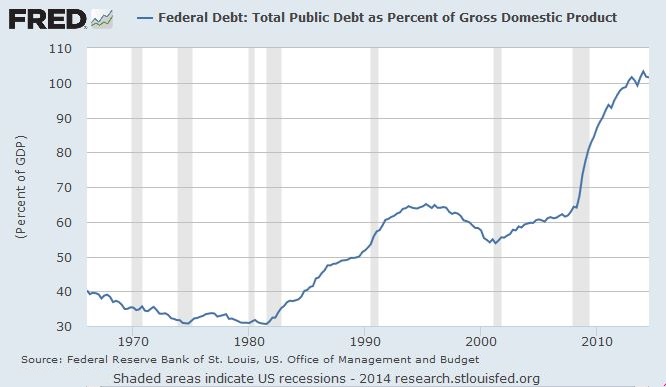
2. PUBLIC DEBT as a % of GDP
D. False Concerns of a Large Public Debt
1. Bankruptcy
a. refinancing
b. taxation
2. Burdening Future Generations
E. Substative Issues of a Large Public Debt (see
below)
1. Income Distribution
2. Incentives
3. Foreign-Owned Public Debt
4. Crowding out of Private Investment
G. The
Future
The nonpartisan CBO in
September of 2013 released a study warning that the next few
years of declining deficits will be followed by a surge of red
ink to cover the mounting costs of Social Security, Medicare
and Medicaid.
The federal
government’s net interest payments would grow to 5 percent
of GDP, compared with an average of 2 percent over the past 40
years, mainly because federal debt would be much larger and
interest rates will rise.
Federal spending for Social
Security, Medicare and Medicaid would increase to a total of 14
percent of GDP by 2038, or twice the 7 percent average of the
past 40 years.
http://www.thefiscaltimes.com/Articles/2013/09/17/CBO-Interest-Rates-Will-Spike-Debt-100-GDP
Substantive Issues
Interest charges are the main burden imposed
by the debt. Interest on the debt was $360 billion in
2012, or 2.3% of GDP
Repayment of the debt affects income distribution.
If working taxpayers will be paying interest to the mainly
wealthier groups who hold the bonds, this probably increases
income inequality.
Since interest must be paid out of government
revenues, a large debt and high interest can increase tax
burden and may decrease incentives to work, save, and
invest for taxpayers.
A higher proportion of the debt is owed to
foreigners than in the past, and this can increase the
burden since payments leave the country. But Americans also own
foreign bonds and this offsets the concern. Foreigners
held about 25 percent of the public debt in 2005., 33% in
2012
Some economists believe that public borrowing crowds
out private investment, but the extent of this effect is
not clear
There are some positive aspects of borrowing
even with crowding out.
1. If borrowing is for public investment that
causes the economy to grow more in the future, the burden
on future generations will be less than if the government
had not borrowed for this purpose.
2. Public investment makes private investment more
attractive. For example, new federal buildings generate
private business; good highways help private shipping,
etc.
|