|
Assignments Chapter 5 - The Public Sector (Government): Role and Finance (includes parts of chapters 5, 22W, 3, and micro Ch.16)
|
In this first unit we are learning fundamental economic principles in the context of globalization and structural adjustment. We have learned that structural adjustment policies include:
Structural Adjustment Policies:
1. Privatization
2. Promotion of Competition
3. Limited and Reoriented Role for Government
4. Price Reform: Removing Controls
5. Joining the World Economy (free trade)
6. Macroeconomic Stability
In this chapter we will look in greater depth at two of these policies
3. Limited and Reoriented Role for Government
4. Price Reform: Removing Controls
We have defined Structural Adjustment as a series of economic policies designed to lessen the role of government in an economy moving it closer to a market economy. The goal of Structural Adjustment Programs (SAPs) is to reduce scarcity and increase society's satisfaction, i.e. to satisfy more of their unlimited wants and achieve the 5Es.
In chapter 2 we discussed the characteristics of market economies or capitalism:
Here we will concentrate on the Reduced Role of Government characteristic. As countries move toward capitalism they reduce the role that their governments play in their economies.
As we address this issue in this chapter we will examine:
REVIEW - Supply, Demand, and Economic Efficiency
In chapter 3 (demand and supply) we explained how market economies achieve allocative efficiency. It would be useful for you to review that section near the end of that online lecture. (See: http://www.harpercollege.edu/mhealy/eco212i/lectures/ch3-17.htm#efficiency.)
WHY ARE MARKETS EFFICIENT?
Businesses will produce the profit maximizing quantity. This is the equilibrium quantity where Qd=Qs (see graph below on the right). This is WHAT WE GET.
Society wants the allocatively efficient quantity. This is the quantity where MSB=MSC (see graph above on the left). This is WHAT WE WANT.
|
|
|
If there are no negative externalities (spillover or external costs) the S = MSC, and if there are no positive externalities (spillover or external benefits) the D = MSB, Therefore: WHAT WE GET = WHAT WE WANT and self-interested, profit maximizing, businesses will end up doing what is best for society - achieving allocative efficiency - as if there is some "invisible hand " guiding their decisions.
SUMMARY:
THEREFORE if there are no negative externalities (spillover or external costs) and no positive externalities (spillover or external benefits) competitive markets (capitalism) achieves allocative efficiency.
and profit maximizing businesses in market economies will produce the allocatively efficient quantity.
This is the "invisible hand" of capitalism.
So, pure market economies usually achieve allocative efficiency and therefore there is only a limited role for government - why do we need the government if the market is already maximizing our satisfaction? If you think about it, in the United States the government does not do very much. The government does not produce our food. It does not build our homes. It does not provide us with electricity, nor heat, nor clothes, nor most of the important things in our lives. But the government DOES provide public education, public parks, public libraries, military/defense, streets and highways, US mail, etc.
WHY?
That is the goal of this chapter.
Before we look at how the economic functions of government help society achieve the 5Es, we will first look at some examples of governments CAUSING INEFFICIENCY.
We noted above, and in chapter three, that usually the working of demand and supply in market economies produce an equilibrium price that achieves allocative efficiency. This is one of the reasons why countries around the world are undertaking structural adjustment, moving their economies toward capitalism by removing price controls. Here we will look at the negative effects of governments controlling prices in market economies.
When governments set prices, it prevent the market from reaching the equilibrium, and the allocatively efficient, price and quantity.
Price Ceilings
A price ceiling is the maximum legal (government set) price that a seller may charge. The GOAL of a price ceiling is to LOWER the price. (The price cannot go through the ceiling.) Therefore, an effective price ceiling is set below the equilibrium (and efficient) price. We will see below that if a price ceiling is set above the equilibrium price, it will have no effect.What is the effect of a price ceiling? Look at the graph below. Without the government this market would result in an equilibrium price of P1 and an equilibrium quantity of Q1. If there are no externalities (we will discuss these soon) then P1 is the allocatively efficient price (what we get = what we want). If the government decides that P1 is too high they may set a price ceiling at Pc. This means the at the highest legal price is Pc. What will happen? At Pc the quantity demanded will be Q2 and the quantity supplied will be Qo. Therefore at the price of Pc there will be a shortage of Q2-Qo. Effective price ceilings cause shortages. This is allocatively inefficient!
Look at the graph below. The efficient quantity is Q1, this is where MSB=MSC, the is WHAT WE WANT but the quantity that we get with the price ceiling is Qo since this will be the quantity supplied by businesses at the price Pc. This is WHAT WE GET. We get less than the efficient quantity so there is an UNDERALLOCATION of resources because at a price of Pc the MSB > MSC. An underallocation of resources means that society is using too few resources on this product or that society would be happier if they produced more of this product an less of something else. Remember from chapter 1 that whenever MB>MC, TOO LITTLE is being done.
If we look at a graph with numbers (see graph below) we see that the equilibrium (and efficient) price and quantity are $9 and 3000 pizzas. If a price ceiling of $6 is put on pizzas then the quantity that will be produce is 2000 since this is the quantity supplied at $6. But at $6 the quantity demanded is 5000, so there will be a shortage of 3000 pizzas. Effective government price ceilings cause shortages and allocative inefficiency.
The principle effect of an effective price ceiling is a shortage and allocative inefficiency. A function of prices is to ration goods and services. Price ceilings counteract this function so alternative methods of rationing must be found to take the places of the price mechanism. These may be formal (rationing coupons) or informal (lines at the pump) or black (illegal) markets may emerge to satisfy the unmet consumer demand.
What would happen if the price ceiling is put ABOVE the equilibrium price? Assume that a price ceiling of $12 is set on pizzas. How many pizzas would be produced?
3000 !
Why? Because if the legal MAXIMUM price is $12 it still allows business to charge less. We discussed in chapter 3 that business want to maximize their profits so, if they can, they will charge the equilibrium price and produce the equilibrium quantity ($9 and 3000). If there is a price ceiling set at $12, business can still charge less and since they want to maximize their profits, they will. The $12 price ceiling, set above the equilibrium price, has no effect.
Examples of price ceilings
Even though price ceilings cause shortages (allocative inefficiency) they do exist. Government leaders either don't understand the important role of free markets or their constituents don't. Examples of price ceilings include:
- Rent controls in large cities - intended to keep housing affordable but resulting in housing shortages.
- Price controls during World War II like the one on gasoline which prompted the government to issue rationing coupons.
- Gasoline price controls in the 1970s which resulted in "out of gasoline" signs at gas stations or "5 gallon limits".
- Anti -price gouging laws after natural disasters like the plywood in Florida example that we have discussed several times.
- Many less developed countries would have price controls on food. the idea was to make food affordable to the poor, but the result was - - a shortage of food. What do we call a shortage of food? FAMINE! Think about it. Millions of people, mostly children, have died, slow painful deaths, because government leaders did not understand that price ceilings create shortages.
Price Floors
A price floor is the minimum legal (government set) price that a seller may charge. The GOAL of a price floor is to RAISE the price. (The price cannot go any lower or it cannot go through the floor.) Therefore, an effective price floor is set above the equilibrium (and efficient) price. We will see below that if a price floor is set below the equilibrium price, it will have no effect.What is the effect of a price floor? Look at the graph below. Without the government this market would result in an equilibrium price of P1 and an equilibrium quantity of Q1. If there are no externalities (we will discuss these soon) then P1 is the allocatively efficient price (what we get = what we want). If the government decides that P1 is too low they may set a price floor at Pf. This means the at the lowest legal price is Pf. What will happen? At Pf the quantity demanded will be Qo and the quantity supplied will be Q2. Therefore at the price of Pf there will be a surplus of Q2-Qo. Effective price floors cause surpluses. This is allocatively inefficient!
Look at the graph below. The efficient quantity, where MSB=MSC, is Q1 and the quantity that we get with the price floor is Q2 since this will be the quantity supplied by businesses at the price Pf. We get more than the efficient quantity so there is an OVERALLOCATION of resources. too much is being produced because at a price of Pf the MSB < MSC. Remember from chapter 1 that whenever MB<MC, TOO MUCH is being done.
If we look at a graph with numbers (see graph below) we see that the equilibrium (and efficient) price an quantity are $9 and 3000 pizzas. If a price floor of $12 is put on pizzas then the quantity that will be produce is 4000 since this is the quantity supplied at $12. But at $12 the quantity demanded is 2000, so there will be a surplus of 2000 pizzas Effective government price floors cause surpluses.
What would happen if the price floor is put BELOW the equilibrium price? Assume that a price floor of $6 is set on pizzas. How many pizzas would be produced?
3000 !
Why? Because if the legal MINIMUM price is $6 it still allows business to charge more. We discussed in chapter 3 that business want to maximize their profits so, if they can, they will charge the equilibrium price and produce the equilibrium quantity ($9 and 3000). If there is a price floor set at $6, businesses can still charge more and since they want to maximize their profits, they will. The $6 price ceiling, set below the equilibrium price, has no effect.
Examples of price floors
Even though price floors cause surpluses (allocative inefficiency) and waste our resources, they do exist. Government leaders either don't understand the important role of free markets or their constituents don't. Examples of price floors include:
- Farm Price Supports are price floors on farm products that are designed to raise the price of farm products to help poor, small, farmers. Of course, like all price floors the result is a surplus - i.e. if the price is higher, farmers will grow more. the way the price supports help farmers is that they sell what they can at the high price and then sell the rest to the government. So, using the graph below, if the price floor is set at $12, farmers would grow a quantity of 4 and consumers would buy a quantity of 2 for $12 (2x12 = 24). The government then would buy the surplus 2 (2x 12 = 24). So farmers make $48 with the price support. without the price support their revenue would only be $27 ($9 x3=$27).
Unfortunately, one of the effects of farm price supports is that most of the money goes to the larger, richer, farms who can grow the largest surplus. and , although the small, "family farmers" do receive larger incomes, it is a very costly way to help poor farmers. Currently (February 2007) there are discussions in congress to reduce the amount of price support money that goes to larger, richer, farms.
- The minimum wage is also a price floor. According to the law you cannot pay your workers any less than the legal minimum wage. One result of the minimum wage is that the number of people employed (quantity demanded) decreases and the number of people looking for work (the quantity supplied) increases, and the result is a surplus of workers. A "surplus" of workers is called "unemployment". Note that in the federal minimum wage is below equilibrium in some labor markets (large cities). In that case the price floor has no effect. Also, in microeconomics we study HOW MUCH unemployment is caused by the minimum wage and HOW MUCH more poor families make. If only a few people lose their jobs due to the minimum wage and if many receive higher incomes then maybe the benefits are greater than the costs.
So government price ceilings and price floors can cause allocative inefficiency. This then is NOT a suggested role of government in a market economy. Just what ARE the economic functions of government?
ACHIEVING THE 5Es: ECONOMIC FUNCTIONS OF THE GOVERNMENT IN A MARKET (Capitalist) ECONOMY
There are five economic functions of government:
The first two (providing the legal structure and maintaining competition) HELP the market achieve the 5 Es. The remaining three (redistributing of income, reallocating of resources, and promoting stability) CORRECT the market when it FAILS to achieve the 5 Es.
Providing the legal structure
Certain conditions must exist in order for the invisible hand of capitalism to work. That is to say, certain conditions must exist in order for the decisions of profit maximizing businesses to achieve the 5 Es for society. They include things like:
For example, businesses in a country at war, or where laws against stealing and arson are not enforced, will not achieve allocative efficiency or economic growth. The government is needed to provide the proper environment.
Maintain competition
When we said at the end of chapter 3 that when businesses produce the profit maximizing quantity (where Qd=Qs) they will also be producing the allocatively efficient quantity (where MSB=MSC assuming no externalities) we should have stressed that this is true ONLY IF THERE IS COMPETITION. In chapter 2 we learned that the definition of competition in economics is slightly different than what most students are used to. Competition exists where there are very many buyers and sellers. If there are not many sellers then profit maximizing businesses WILL NOT be allocatively efficient.
For example, we have said that after a hurricane hits the coast of Florida it may be GOOD for the people of Florida if the price of plywood increases, because higher prices will help prevent shortages. But this is only true if there is competition. If there is only ONE seller (a monopoly) of plywood in Florida then they may take advantage of the situation and raise prices greatly resulting in extreme profits and allocative inefficiency. If there are many sellers of plywood in Florida, they will compete for your business and the price will not go as high. We get efficiency in capitalist economies only if we truly have capitalism. One of the characteristics of capitalism is COMPETITION.
Therefore, one of the roles of the government in a capitalist economy to to assure that there is competition.
In microeconomics we study an exception to this rule. If a "natural monopoly" exists, the government allows it to continue and regulates price and service. This is why the government allows there to be only one electric company and then regulates electricity rates. Commonwealth Edison is a natural monopoly and therefore has the only license in northern Illinois to distribute electricity. This is more efficient than if we had many electric companies, all running wires to every house.
Where competitive markets are more efficient, the government uses anti-monopoly laws called "anti-trust" laws which promote competition. with these laws the government can "break up" an monopoly into several smaller, competing, companies.
The above roles of government HELP capitalism achieve the 5 Es. Sometimes, even with competition, a capitalist economy will not achieve the 5 Es. Therefore society is not reducing scarcity as much as possible and not maximizing its satisfaction. In these cases where the market FAILS to achieve the 5 Es the role of government is to INTERVENE to CORRECT the market failure.
Redistributing of income
There is nothing built into capitalism that assures a fair distribution of income (equity). In fact, in many command economies the distribution of income is more equal (fair??) than in capitalist economies. In the first chapter we discussed the actual distribution of income in the US and in the world. to review see the links below:
If the government determines that the distribution of income is not "fair", what can be done? There are three commonly used policies to achieve equity.
Transfer Payments are often used. Transfer payments are payments for which nothing is expected in return. Transfer payments (welfare) provide relief to the poor, dependent, handicapped, and unemployment compensation to those unemployed who qualify for benefits. Social Security and Medicare programs support the sick and aged. All of these redistributes income among groups in society.
In the US the progressive personal income tax takes a larger proportion of incomes of the rich than the poor. We will discuss this in greater detail later in this online lecture.
Sometime, in order to achieve equity, the government intervenes in markets by modifying prices, i.e. they enact price ceilings and price supports. Price support programs for farmers and minimum wage laws are examples. We have said above that price supports and price ceiling may CAUSE INEFFICIENCY, but they may also help society achieve EQUITY. Sometimes there is a tradeoff between equity and efficiency. Most economists would advise that the government be careful if using price supports or price ceilings to achieve equity. Often, the increase in allocative inefficiency outweighs the benefits of more equity ESPECIALLY if there are other options available, like transfer payments and progressive income taxes, to achieve equity.
Reallocation of resources:
Market failure occurs when the competitive market system produces the "wrong" amounts of certain goods or services or fails to provide any at all. In such cases the government may intervene to improve the allocation of resources and achieve allocative efficiency. There are three examples of market failures that result in allocative inefficiency WITHOUT government intervention:
Negative Externalities (spillover or external costs)
Externalities occur when some of the benefits or costs of production are not fully reflected in market demand or supply schedules. Some of the benefits or costs of a good may "spill over" onto third parties.A negative externality occurs when some of the costs of producing or consuming a product are not paid by the producer or consumer by rather "spillover" onto a third party who otherwise would not be involved in the market transaction. If negative externalities exist the producer AVOIDS some of the costs of production so their costs are lower. With lower costs, more - too much - will be produced.
Graphically when negative externalities exist the supply curve does not equal the MSC curve. Since the firm AVOIDS some costs, the costs to the firm are lower than the costs to society and the supply curve is further to the right (supply increases when costs decrease). So the profit maximizing quantity occurs where Qs=Qd or at quantity 2 on the graph below. This is the quantity that will be produced. This is WHAT WE GET when negative externalities exist. But the allocatively efficient quantity is 1, where MSB=MSC. This is the quantity that maximizes society's satisfaction. This is WHAT WE WANT. So when negative externalities exist TOO MUCH will be produced and there is an overallocation of resources. At quantity 2 the MSB<MSC. We said in chapter 1 that when MB<MC too much is being done.
An example of a negative externality (or spillover or external cost) is any product that creates polution when produced or consumed. pollution. Assume that a paper manufacturer dumps toxic chemicals into a river killing the fish sport fishers seek. The buyer in this market is the purchaser of paper. The seller is the paper manufacturer. If the firm is allowed to pollute the river a third party, i.e. people who fish, or live, downstream, suffer from this pollution. They pay the cost. A negative externality allows polluters to enjoy lower production costs because the firm is passing along the cost of pollution damage or cleanup to society. Because the firm does not bear the entire cost, it will overallocate resources to the production of goods. TOO MUCH will be produced. Other products that have negative externalities (or spillover or external costs) include:
- cigarettes
- alcohol
- gasoline
So what is the role of government when negative externalities exist? Well, the GOAL is to reduce the amount that is produced. Using the graph above the goal would be to reduce the quantity from 2 to 1.
To correct for negative externalities requires that government get producers to internalize these costs. There are two ways that the government can do this:
1. Legislation can limit or prohibit pollution, smoking, drinking, etc. Such legislation causes the firm's costs to increase and the firm's supply curve to shift to the left resulting in a higher price and a smaller quantity demanded. (See graph below.)2. Specific taxes on the amounts of pollution, smoking, alcohal, etc. can be assessed, which causes the firm's supply curve to shift to the left resulting in a higher price and a smaller quantity demanded. (See graph below.)
Think about the products that the government does tax: alcohol, cigarettes, gasoline. Now we know why. Because without the tax the produce avoids some costs and passes them onto society as a whole. therefore without the tax the price would be lower and more would be consumed. TOO MUCH would be consumed - more than the quantity that is optimum for society or the allocatively efficient quantity.
Have you ever wondered why bar owners live above their bars? It may be so that they can avoid the problems of drunk drivers leaving their bars. This way they feel safer and can sell more alcohol and make more money. What would happen to the amount of alcohol sold if there was a law that said all bar owners or bartenders must stand in the middle of the street outside their bar when their customers leave? Would they sell the same amount to their customers? I believe that in this case THEY would have to PAY (possibly with their lives) if they sell the profit maximizing quantity of alcohol to their customers, so they would sell less which would be better for society.
Another example of spillover or external costs, or negative externalities is gasoline. Even with the national average gasoline tax of $0.44 per gallon we might ask if the price of gasoline is still TOO LOW? The following question is on our class Discussion Board. Read the instructions below, listen to the five minute news article, then post your comments on our class Dissuasion Board.
DISCUSSION BOARD DISCUSSION QUESTION APPLICATION: SHOULD GAS PRICES BE HIGHER?
Listen to the news article below.
As you listen try to explain the following:
- Why does James Surowiecki believe the current price of gasoline is too low and results in inefficiency?
- which kind of inefficiency?
- does he believe that there are spillover or external costs or spillover or external benefits and what are they?
- how would you show the inefficient quantity on a graph
- What are the effects of the higher tax that James Surowiecki is proposing?
- what effect does it have on efficiency?
- how would you show the effect of the higher tax on a graph
- how would you use a graph to discuss how the tax makes the market for gasoline more efficient
Arguing the Upside of High Gas Prices
Morning Edition, September 22, 2005, National Public Radio
One writer believes gas prices actually should be high. Steve Inskeep talks with James Surowiecki, a financial columnist for The New Yorker who says a 50-cent gas tax would make drivers pay for the real cost of cars on the road and make business cater to the fuel-conscious.
Click here to listen:
http://www.npr.org/templates/story/story.php?storyId=4858826After listening to the news article and after studying chapter 4, do you support higher gasoline taxes? Discuss this issue on the class Discussion Board.
Positive Externalities (spillover or external benefits)
A positive externality ( or spillover or external benefit) occurs if some of the benefits of producing or consuming a product "spillover" onto a third party who does not have to pay. Not just the buyer or the seller benefit but someone else also benefits Public health vaccinations and education are two examples. Other examples of products with positive externalities are public parks and public libraries. Because some of the benefits of these services go to others, not just the person being vaccinated or the student being educated, but others also benefit. Even if you do not get vaccinated you will benefit if everyone else does. It is not just the student (or the school and teachers) who benefit from your education but also future employers and society as a whole benefit. When positive externalities exist individuals will demand too little for themselves and resources will be underallocated by the market. Therefore positive externalities are bad for society.Since some people benefit from positive externalities who do not demand, or pay for, the product, the demand curve does not include all of the benefits that society gets from the product. The demand curve only measures the benefits that go to those who demand, and pay for, the product. Therefore the demand curve does not equal the MSB (marginal Social Benefits) that all of society receives from the product. The demand will be less than the MSB and on the graph the demand curve will be further to the left. See graph below.
Profit maximizing business will produce the equilibrium quantity where QS = Qd, or quantity 1 on the graph below. But the allocatively efficient quantity is where MSB=MSC or quantity 2 on the graph below. When positive externalities exist TOO LITTLE will be produced, there will be an UNDERallocation of resources to the production of these products, and society will suffer from allocative inefficiency.
Correcting for positive externalities requires that the government somehow increase the quantity to the allocatively efficient amount. The goal of government is to have more produced - more than what would be produced if there were no government involvement. The government has three tools to achieve this:
1. Government can increase demand by providing subsidies to consumers like food stamps and education grants to subsidize consumers. On the graph this would increase demand because it is like giving consumers additional income to buy the product. See Graph.2. Government can finance production of good or service itself such as public education or public health. This would increase supply just like having more producers. (See graph below.)
3. Government can increase supply by subsidizing production, such as higher education, immunization programs, or public hospitals. This would also increase supply. (See graph below.)
Note that government finance and subsidizing producers does not increase demand, but it does increase the quantity for 1 to 2 which is just what society wants.
REVIEWNEGATIVE EXTERNALITIES (spillover or external costs)
- Define Negative Externalities (Spillover Costs)
- Examples of spillover or external costs:
- Use the graph below to answer the questions that follow.
- What is the allocatively efficient quantity?
- What is the profit maximizing quantity?
- Which quantity will be produced without government involvement?
- Is there an OVER allocation or an UNDERallocation of resources?
- What is the goal of government involvement?
- What are the possible government policies to achieve this goal?
POSITIVE EXTERNALITIES (spillover or external benefits)
- Define Positive Externalities (spillover or external benefits)
- Examples of Positive Externalities (spillover or external benefits)
- Use the graph below to answer the questions that follow.
- What is the allocatively efficient quantity?
- What is the profit maximizing quantity?
- Which quantity will be produced without government involvement?
- Is there an OVER allocation or an UNDERallocation of resources?
- What is the goal of government involvement?
- What are the possible government policies to achieve this goal?
Public Goods
A third example of a market failure (when the competitive market system produces the "wrong" amounts of certain goods or services or fails to provide any at all) is public goods. The term "public good" has a different definition in economics than that which we are use to. A public good has the characteristics of being NONRIVAL and NOT BEING SUBJECT TO THE EXCLUSION PRINCIPLE. Because of these characteristics public, or social, goods would not be produced through the market. Therefore if these are products that society wants then the government must provide public goods (and quasi-public goods) and services. Otherwise NONE would be produced and there would be a severe UNDERallocation of resources. NOTE that the term "public good" does NOT MEAN that it is produced by the government. The government produces many "private goods". Private goods are different than public goods are usually produced through the market because they are rival (one's use of a good makes it unavailable for others) and come in units small enough to be afforded by individual buyers. Private goods are subject to excludability, the idea that those unable and unwilling to pay do not have access to the benefits of the product.
Public goods than are nonrival, meaning one person can use the good and there is just as much left for others to use, and public goods are NOT subject to excludability, meaning that there is no way to economically exclude those who are unable or unwilling to pay. Even those who do not pay can get the good and there is nothing that can be done to stop them. The efforts to reduce terrorism and national defense in general are good examples of public goods. Increased national security is there for all to enjoy whether or not they paid for it. Those who receive benefits without paying are part of the so called free rider problem. Other examples include flood control, lighthouses, street lights, insect control.
Why would private businesses not produce such goods? Producers would not be able to find enough paying buyers for "public goods" because of the free rider problem mentioned above. Therefore, "public goods" are not produced voluntarily through the market but must be provided by the public sector and financed by compulsory taxes.
Are the following public goods? If not why does the government provide them?
1) public education
2) public parks
3) public libraries
No, these are not public good because it is economically possible to exclude nonpayers if we wanted to. We could charge people to use public parks, public libraries, public education so they are subject to the exclusion principle. Furthermore they are rival goods. If I check out a book form the library, use a table at a public park, or register for a spot in this economics class, are there just as many left over for others? No. So - if public goods have to be produced by the government and if these goods are not public goods, why are they produced by the government too?
The answer is above - - - these goods have positive externalities. Sometimes such goods are called quasi-pubic goods.
Promoting stability:
An economy's level of output is dependent on its level of total spending relative to its productive capacity.
2. The government may promote macroeconomic stability through changes in government spending and taxation.
a. When total spending is too low, the government may increase its spending and/or lower taxes to reduce unemployment; the central bank may lower interest rates.b When total spending is excessive, the government may cut its spending and/or raise taxes to foster price stability; the central bank may raise interest rates.
Government's Role: A Qualification
1. Government carries out its economic functions within a political context (and the constraints on activity that come with that).2. In attempting to balance and satisfy both political and economic objectives, government may end up over- or under-regulation, or over- or under-providing public goods.
GOVERNMENT FINANCE.
Before we discuss the economic functions of the government in a market economy we will first look at government finance - or government spending and taxes.
We have defined economics as the study of how we choose to use limited resources to obtain the maximum satisfaction of unlimited human wants.
We have used our 5Es model to better understand what this definition implies. There are five ways for a society to reduce the effects of scarcity. (Actually there are six if we include "reducing wants".) The study of macroeconomics focuses on two of these: Economic Growth and Full Employment.
To these issues we will add price stability (low inflation). So the issues discussed in MACROeconomics are:
1. full employment,
2. price stability, and
3. economic growth
Governments in market economies often employ policies to help the economy achieve these goals. Some of these policies involve government spending and taxation. People often complain about government spending and taxes, but it is surprising how little they actually know about them.
You do not have to memorize all the data that follows, but you do need to know the simple structure: what are the main sources of government revenues and and what are the main government expenditures categories? We'll analyze government finance by looking at each level of government in the United States:
Government Finance
Federal Finance (see Figure 4.8)
State and Local Finance
LAST WORD: The Long-Run Fiscal Imbalance: Social Security
OUTLINE -- CHAPTER 5
Government Finance
I. Federal Finance
A. Federal Expenditures1. pensions and income security
2. national defense
3. health
4. interest on the public debt
5. otherB. Federal Tax Revenues
1. personal income tax
2. payroll taxes
3. corporate income tax
4. excise taxesC. State and Local Finance
1. state expenditures and receipts
2. local expenditures an receiptsD. Personal Income Tax
1. taxable income
2. progressive taxa. marginal tax rates
b. average tax rates3. 1999 Fed. Income Tax Rates
http://www.irs.gov/prod/ind_info/tax_tables/tax_sched.html
TAX TABLE: http://www.irs.gov/prod/forms_pubs/graphics/10311g75.gif
TAX SCHEDULE: http://www.irs.gov/prod/forms_pubs/graphics/10311g87.gifE. Government Growth
1. ways to measure government size
2. purchases vs. transfer payments
(exhaustive and nonexhaustive expenditures)
3. growth of government expenditures
a. correcting for inflation
b. compared to other sectors
c. growth of transfer payments
Federal Government Finance
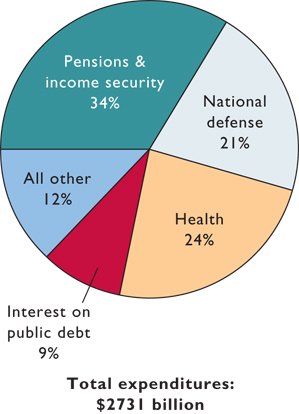
Study the following figures to learn the primary sources of federal government revenues and where the money is spent.
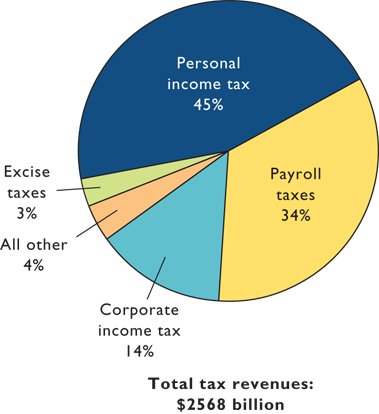
Federal Tax Revenue Sources:1. personal income tax
2. social security taxes
3. corporate income tax
4. excise taxesFederal Government Expenditures:
1. pensions and income security (includes welfare and social security)
2. national defense
3. health
4. interest on the public debt
5. otherComments:
Which of the taxes you pay go to Washington? - NOT sales taxes, NOT property taxes.
On what does the federal government spent money? - Not education. Actually, after Social Security, welfare, defense, health care, and interest on the debt, only nine percent (9%) is left for the issues that many people are talking about (education, the environment, energy, etc.).
State Government Finance
Study the following figures to learn the primary sources of state government revenues and where the money is spent.
State Tax Revenues Sources:1. Sales taxes
2. Excise taxes
3. Income taxes
4. Business taxesState Government Expenditures:
1. Education
2. Welfare
3. Health
4. TransportationComments:
Note that property taxes are NOT state taxes for almost all states.
Local Government Finance
Local governments include counties, cities, townships, school districts, park districts, library districts, etc. Illinois has a large number of these local government bodies that have the authority to collect taxes. Study the following figures to learn the primary sources of state government revenues and where the money is spent.
Local Tax Revenues Sources1. Property taxes
2. Sales and Excise taxesLocal Government Expenditures
1. Education
2. Health and WelfareComments:
Note that local governments rely mostly on property taxes to fund their programs. Most local governments ARE school districts, so it shouldn't surprise us that education is the largest expenditure category.
Since the main source of federal government revenues is the personal income tax, and since many people misunderstand the federal income tax rates, and since these are sometimes used as part of a macroeconomic policy to lower unemployment (UE) or to lower inflation (IN), I think we should spend a little time studying them.
Tax Rates
In 2000 the federal income tax rates were:
15%
28%
31%
36%
39.6%
BUT, whenever you see "%", you must ask "percent of what?"
First, it is percent of "taxable income" Taxable income is your income MINUS deductions. In the discussion that follows, the word "income" will mean "taxable income", but keep in mind that your taxable income can be quite a bit less than your total income.
These tax rates are "marginal tax rates", NOT "average tax rates" Most students, and many politicians often confuse the two.
An average tax rate is the percent of your income that you pay in taxes. To calculate the average tax rate you divide the amount you pay in taxes by your income;
|
taxes paid |
||
|
average tax rate = |
|
x 100 |
|
total income |
The marginal tax rate, which is what is used on our income taxes, is the percent of ADDITIONAL income that you pay in taxes ("marginal" means "additional" or "extra").
|
additional taxes paid |
||
|
marginal tax rate = |
|
x 100 |
|
additional income |
This is important. Look at the 2000 Federal Income Tax schedule for a single person.
|
Schedule X -- Use if your filing status is Single |
||||
|
If the amount on |
|
|
of the |
|
|
|
||||
|
$0 |
$26,250 |
......... |
15% |
$0 |
So, if your (taxable) income is $26,250 you pay 15% in taxes or $3,937.50 (.15 x $26,250 = $3,937.50) or you are paying 15% of your income (taxable income) in taxes. BUT, if you receive a $1000 dollar raise, your income is now $27,250 and you are in the 28% tax bracket. If this 28% was an average tax rate, then you would have to pay .28 x $27,250 = $7630. You received a $100) raise, but your taxes would go up $3692.5 ($7630 - $3,937.50). You would beg your boss NOT to give you a raise because you end up with less take-home pay than before.
BUT IT DOESN'T WORK THAT WAY, because the tax rates are MARGINAL tax rates and they only apply to ADDITIONAL income. So you pay 15 % of the first $26,250 (= $3,937.50) and 28% of the additional $1000 (= $280). So if your income is $27,250, you will pay $4142.50 in taxes ($3,862.50 + $280 = $4217.50).
So, if your income is $27,250, you are in the 28% tax bracket, but what is your average tax rate? What percent of your total income are you paying in taxes? See the formula above: Average tax rate = taxes paid divided by total income. so if your income is $27,250 your average tax rate is $4142.50 / $27,250 = 15.2 %. You are in the 28% tax bracket, but you are paying 15.2% of your income in taxes. Actually, you are paying a lot less than 15.2% of your total income in taxes since the tax rates apply only to your taxable income.
PROBLEM: Use the table above to calculate the taxes that you would have to pay if your taxable income was $73,550 Also, calculate the marginal tax rate and the average tax rate (answers).
Government Growth
What has happened to the SIZE of government? Many people argue that the government is getting bigger. How would we know? How would we measure the size of government?
One way would be to compare how many laws and regulations that the government makes in a year. I think that if we used that as the measure the government is probably getting bigger.
Another measure could be the number of governmental employees compared to nongovernmental employees. "The ratio of civilian governmental employees per 1000 population has actually dropped from a peak of 16.5/1000 in 1952 to 11/1000 in 1995." (http://www.harding.edu/USER/lklein/WWW/KWTEST3CPA.HTM)
A popular measure of the size of government is the amount that they spend. See the graph below:
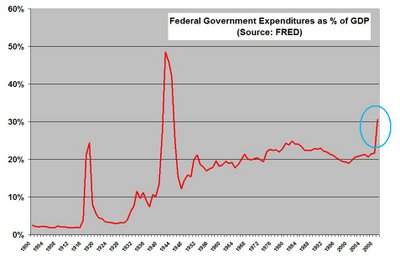
But most of the increase in government expenditures occurred in Social Security, Medicare, and other medical care.
Expenditures such as these are called "transfer payments" because the government is NOT BUYING ANYTHING, but simply transferring money from the taxpayers to certain groups of recipients. If we want to see how the size of government affects SCARCITY we should exclude such transfer payments because the government is not using up any resources. See table below.

From: http://www.rand.org/publications/RB/RB2500/rb2500.html
The government purchases about 20% of what is produced in the country and this has stayed about the same since World War II.
Is the government getting bigger? -- NOT as a user of our limited resources.
Your calculations: $17,481.50
IRS table: $ 17,489 ( See: 10311g83.gif)
Marginal tax rate: 31%
Average tax rate = $17,489 / $73,550 = 23.8%
HOW TO GET THE ANSWER:
PROBLEM: Use the table above to calculate the taxes that you would have to pay if your taxable income was $72,450. Also, calculate the marginal tax rate and the average tax rate (answers).
How to calculate:
Your income is $73,550
You pay 15% of the first $26,250 or .15 x $26,250 =
$3937.50
You pay 28 % on income between $26,250 and $63,550 or .28 x
$37,300 = $10,444.00
You pay 31% on income over $63,550 or .31 x $10,000 =
$3100.00
Now add:
|
$3,937.50 |
OR according to the tax schedule "If the amount on Form 1040, line 39, is: Over $63550, but not over $132,600 Enter on Form 140 Line 40 $14,381.50 + 31% of the amount over $63,550", so you add 14,381 + 3100 to get $17,481
Since your income is $73,550, it is more than $63,550, but not
over $132,600.
Therefore, you can see from the tax schedule below you are in the 31%
tax bracket. This is your marginal tax rate.
Tax Schedule:
|
Schedule X -- Use if your filing status is Single |
||||
|
If the amount on |
|
|
of the |
|
|
|
||||
|
$0 |
$26,250 |
......... |
15% |
$0 |
An average tax rate is the percent of your income that you pay in taxes To calculate the average tax rate you divide the amount you pay in taxes by your income;
|
taxes paid |
||
|
average tax rate = |
|
x 100 |
|
total income |
Therefore,
|
$17,481.50 |
||
|
average tax rate = |
|
x 100 |
|
$73,550 |
average tax rate = 23.8%