Chapter 7 - Measuring Domestic Output and National
Income
Measuring the Economy
|
What you need to know:
- Define GDP.
- Why is GDP a "monetary measure"?
- What are "double counting", "intermediate goods",
and "final goods"?
- What is included in GDP and what is excluded?
- How to calculate GDP using the expenditures
approach.
- How to calculate net exports (Xn)
- What is included in Gross Private Domestic
Investment (Ig)
- Define and calculate Net Private Domestic
Investment (In)
- What it means when Net Private Domestic Investment
is positive, zero, and negative.
- How to calculate National Income
|
NI = Wages + Rents + Interest +
Corp. Profits + Prop. Income
|
- Define and calculate Net Domestic Product (NDP)
|
NDP = GDP - depreciation
NDP - C + In + G +
Xn
|
- Define National Income (NI)
- Define Personal Income (PI)
- Define Disposable Income ((DI)
- Define nominal GDP
- Define and calculate real GDP
|
real GDP = nominal GDP / (GDP
Price Index/100)
|
- Know the problems (shortcomings) of using GDP as a
measure of social welfare (how well the economy is
doing) and whether, because of them, GDP tends to
OVERstate or UNDERstate social welfare
|
Introduction
We've been using the AS - AD model to understand the
macroeconomy. The vertical axis measures the PRICE LEVEL which is
the average level of prices in an economy. The horizontal axis
measures REAL DOMESTIC OUTPUT which is all the goods and services
produced in an economy.
But WHAT NUMBERS do we put on the axes? How do we measure the
price level and real domestic output?
We measure real domestic output with REAL GDP and we measure
the price level with a PRICE INDEX.
In this lesson we'll learn how to calculate real GDP and a
price index.
Measuring Real Domestic Output: real GDP

We will use "real GDP" to measure real domestic output - the
total amount of output produced in an economy . The table below
lists the GDP for a few countries.
|

NOTE: 2007 data
|
Populations:
- US: 303 million
- Japan: 128 million
- Germany: 82 million
- China: 1,324 million
- UK: 60 million
- France: 61 million
- Italy: 59 million
- Canada: 32 million
- Brazil: 192 million
- India: 1,158 million
- S. Korea: 48 million
- Mexico: 112 million
- Australia: 20 million
|
Note, that if you wish to COMPARE countries you should use GDP PER
CAPITA which is GDP divided by the country's population (GDP per
person). Even though the United States has the world's largest GDP,
it is not the highest GDP per capita. For a table of GDP per capita
see: http://www.nationmaster.com/graph/eco_gdp_percap-economy-gdp-per-capita
Definition: GDP
Gross Domestic Product is the
total market value of
all final goods and
services that
are produced in the
economy in one year.
This is one definition that should be memorized. As you can see
it has three components.
(1) "total market
value"
How can we add the number of buildings produced to
the number of candy bars produced to the number of cars
produced, etc.? To do this we need a common unit of measure.
The unit of measure for real domestic output or real GDP is
the market value or money
To get the "total" market value then one would think that
you would add up the price times the quantity of everything
produced:
GDP = SUM P x Q
GDP =  P this year x
Q this year
P this year x
Q this year
GDP equals the sum of the prices times quantities of
everything produced in a year
This, then, would give you the total market value of
everything produced.
(2) "final goods and
services"
Only final goods and services are included to avoid
double counting
Final goods are bought and used by the
final consumer. When you buy a hamburger from McDonald's
the value of the hamburger should be included in GDP
because it is a final good.
Intermediate goods are bought so that they can
be resold or further processed. When McDonald's buys
buns, ground beef, and ketchup, the value of these
purchases of intermediate goods are NOT added to GDP
since they will be added when a consumer buys the
hamburger (a final good).
If we included the price of the hamburger AND the
value of the bun, ground beef, and ketchup then these
would be counted twice.
Another way to avoid double counting is to use the
value-added method and only add what McDonald's spends on
buns, ground beef, and ketchup, but then NOT include what
consumers spend on the hamburger.
The point is we want to get a measure of the market value
of the final goods that an economy produces.
(3) "produced in one
year"
GDP is a measure of what is produced or made in one
year, therefore:
a. secondhand sales are not included because
nothing new is produced, and
b. financial transactions not included because nothing is
produced
A car produced in 1999 is included in 1999's GDP.
Therefore, if a used 1999 vehicle is sold in the year 2001
we would NOT again include its price in the GDP for 2001
since it was not produced then. We WOULD include the profits
earned by the used car salesperson in 2001 since he or she
did clean, advertise, and sell the used car in that year,
but we would not include the value of the 1999 car
itself.
Also, a lot of the "business news" that you hear
concerning the billions of dollars spent on stocks and bonds
each day does not affect the GDP directly.
When people buy stocks and bonds from whom do they buy
them? If I buy $100 of stock in IBM, from whom do I buy it?
I may buy it through a stock broker, but whose stock do I
buy? I probably didn't buy it from IBM (unless it was an IPO
- Initial Public Offering), but rather I bought it from
somebody who had bought it earlier. In other words, I bought
"used" stock. But the main point is, when I buy $100 on IBM
stock, nothing is being produced so the $100 is not added to
GDP.
|
REVIEW: (Textbook Question
7-13)
Which of the following are actually included
in this year’s GDP? Explain your answer in
each case.
a. Interest on an AT&T corporate
bond.
b. Social security payments
received by a retired factory worker.
c. The unpaid services of a
family member in painting the family home.
d. The income of a
dentist.
e. The money received by Smith
when she sells her economics textbook back to
the bookstore.
f. The monthly allowance a
college student receives from home.
g. Rent received on a
two-bedroom apartment.
h. The money received by Josh
when he resells his current-year-model Honda
automobile to Kim.
i. The publication of a
college textbook.
j. A 2-hour decrease in the
length of the workweek.
k. The purchase of an AT&T
corporate bond.
l. A $2 billion increase in
business inventories.
m. The purchase of 100 shares
of GM common stock.
n. The purchase of an
insurance policy.
ANSWERS
are at the bottom of this webpage.
|
Circular Flow Model
The circular flow model can help us to understand the two
approaches used to measure GDP.
1. expenditures approach
2. income approach
Arrow # 3 is real GDP (goods and services produced). This is
output produced by business and sold in the product markets to
consumers (households). This is what we want to measure. This is real
domestic output. This is GDP.
To measure this level of produced output we can measure arrow #4
which are the expenditures spent on this output. This is the
EXPENDITURES APPROACH. If something is produced and sold the amount
sold should equal the amount produced. The only problem with this is
what happens if something is produced one year but not sold in the
next year? If we just added up the market values of goods and
services that were sold these items would be included in the wrong
year. To handle this problem we include items produced one year and
sold the next as changes in business inventories which ARE included
the year that they are produced.
We can also measure arrow #1 which is the income earned by
households when they sell their resources (arrow #2) to businesses.
The value of output produced (GDP) is equal to the value of ALL the
income earned by everyone who had anything to do with producing the
output. If a $20,000 car is sold, then $20,000 was earned by everyone
who was involved in producing and selling the car. So to measure GDP
( the value of the products produced) we can sum up all the income
earned in producing that level of GDP. This is the INCOME APPROACH to
calculating GDP.
Expenditures Approach
KNOW THIS !
GDP = C + Ig + G + Xn
1. personal consumption expenditures (C) includes durable
goods (lasting 3 years or more), nondurable goods and services.
2. gross private domestic investment (Ig)
Remember that we defined investment as the "accumulation of
capital" and we defined capital as "manufactured resources" so
investment occurs when businesses buy capital. If a carpenter buys
a hammer it is an investment. (Note: if an economist buys 100
shares of stock in Microsoft, it is NOT an economic
investment.)
[Noninvestment transactions - despite how the term
"investment" is used by the general public, investment does not
include transfers of ownership of paper assets (stocks and bonds)
or real assets (houses, jewelry, art). Only newly created capital
is counted as investment.]
Economic Investment includes:
1) all final purchases of machinery, equipment, and
tools by businesses
2) all construction (including homes)
3) changes in inventories (To include items produced one year
but sold the next. If businesses are able to sell more than
they currently produce, this entry will be a negative number. )
gross vs. net domestic investment (In)
Gross investment is ALL NEW INVESTMENT and includes
the three items listed above.
Net investment includes only the CHANGES to the nation's
capital stock
Each year as new goods and services are being produced, some
of the existing capital equipment is wearing out and buildings
are deteriorating. This is called "depreciation" or
"consumption of fixed capital". Whereas gross investment adds
to a country's stock of capital, depreciation reduces a
country's stock of capital.
Net investment = Gross Investment - depreciation
In = Ig - depreciation
Net investment is related to economic growth.
If net investment is positive then the country ends up
with more capital at the end of the year than it stated
with. Since we know that economic growth is caused by
getting "more resources", if net investment is positive then
the economy is growing, ("expanding economy").
What type of economic growth is this (1)
increasing our potential from the 5Es or, (2) achieving
our potential (or achieving full employment)?
It would be "increasing our potential" which is caused
by getting more resources, better resources, and better
technology.
If net investment is negative this means that
depreciation is greater than gross investment, or more
capital wears out than is produced so we would have a
"declining economy".
If gross investment (all new capital that is produced)
EQUALS depreciation (capital that wears out) then net
investment will equal zero. there will be no changes to
amount of capital that a country has, and there will be a
"static economy".
3. government purchases (G)
This includes purchases by all levels of government
(federal, state and local). Whenever the government buys
something or pays somebody it is included in government
purchases.
Government purchases does NOT include transfer payments.
Transfer payments, by definition, are payments for which
nothing is expected in return. Government transfer payments
include welfare and social security payments, transfers from
the federal government to state government and from state to
local governments. These are not included in GDP as government
purchases because when the government transfers money, NOTHING
IS PRODUCED and GDP only includes production. Of course, when
people on welfare spend their government check on food and rent
then this does enter GDP as consumption (C).
4. net exports (Xn)
Net exports (Xn) included the value of all exports
from a country minus the value of all imports.
Xn = X - M
If a country has a trade deficit then the value of imports
is greater than the value of a country's exports and net
exports (Xn) is negative.
It should be obvious why exports is included in GDP and it
should be obvious why imports should NOT be added to GDP. But
why do we have to SUBTRACT imports from GDP. Subtracting is a
lot different than not adding.
Imports are subtracted from GDP because they were
incorrectly included in consumption expenditures (C). Since
imports are produced in another country they should not be
added to our GDP, but they are added as art of of consumption
so therefore they have to be removed.
Practice Problem
Given the data below, use the EXPENDITURES APPROACH to
calculate GDP.
|
Use the data below to calculate the GDP of this
economy using the expenditures approach. All figures are
in billions.
|
Personal consumption expenditures
|
$400
|
|
Government purchases
|
128
|
|
Gross private domestic investment
|
88
|
|
Net exports
|
7
|
|
Net foreign factor income earned in the
U.S.
|
0
|
|
Consumption of fixed capital
|
43
|
|
Indirect business taxes
|
50
|
|
Compensation of employees
|
369
|
|
Rents
|
12
|
|
Interest
|
15
|
|
Proprietors' income
|
52
|
|
Corporate income taxes
|
36
|
|
Dividends
|
24
|
|
Undistributed corporate profits
|
22
|
|
|
|
ANSWER: Before scrolling down, pick up some paper and a pencil
and actually calculate GDP. DOING it yourself is better than
reading it.
.
.
.
.
.
From the table we get:
|
GDP
|
=
|
C
|
+
|
I
|
+
|
G
|
+
|
Xn
|
|
GDP
|
=
|
400
|
+
|
128
|
+
|
88
|
+
|
7
|
GDP = C + I + G + Xn = 400 + 128 + 88 + 7 = $ 623
The Real World - the 2007 United States GDP:
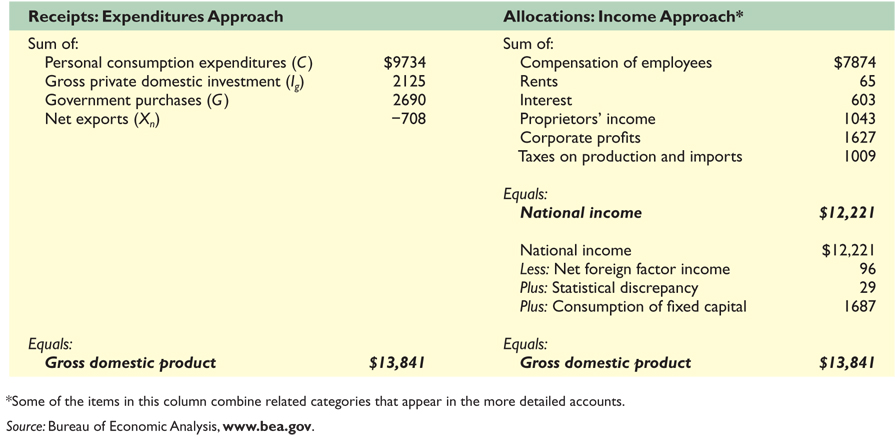
Income Approach --calculating national income (NI)
A second way to calculate GDP is by adding up all INCOME
- flow #1 in the circular flow diagram below is the income
received when resources are sold to businesses.
There are four types of resources (four factors of
production):
- labor
- land
- capital
- entrepreneurial ability
Each of these resource types receives what economist call
INCOME when they are sold:
- labor receives wages
- land receives rent
- capital receives interest
- entrepreneurial ability receives profits
So if we add up:
wages + rent + interest + profits
we should get GDP -- well almost. Actually we get something
called National Income (NI), or the income EARNED by the
resources. the textbook goes through the calculation on how to get
from NI to GDP - but we won't have to do that in this course. What
we will do is divide the profits earned by entrepreneurs into two
types: proprietor's income and corporate profits. So:
|
NI = Wages + Rents + Interest + Corp. Profits
+ Prop. Income
|
[The new edition of our textbook now also adds
Taxes on production and imports including general sales taxes,
excise taxes, business property taxes, license fees, and
customs duties to the above to get NI -- we will not do this
either.]
Definitions:
national income: all income earned by American
supplied resources, whether here or abroad, plus taxes on
production and imports.
Compensation of employees includes wages, salaries,
fringe benefits, salary and supplements, and payments made on
behalf of workers like social security and other health and
pension plans.
Rents: payments for supplying property resources
(adjusted for depreciation it is net rent).
Interest: payments from private business to suppliers
of money capital.
Proprietors' income: income of incorporated
businesses, sole proprietorships, partnerships, and
cooperatives.
Corporate profits: After corporate income taxes are
paid to government, dividends are distributed to the
shareholders, and the remainder is left as undistributed
corporate profits (also referred to as retained earnings).
Practice Problem
Given the data below, use the INCOME APPROACH to calculate
National Income (NI).
|
Use the data below to calculate the GDP of this
economy using the income approach. All figures are in
billions.
|
Personal consumption expenditures
|
$400
|
|
Government purchases
|
128
|
|
Gross private domestic investment
|
88
|
|
Net exports
|
7
|
|
Net foreign factor income earned in the
U.S.
|
0
|
|
Consumption of fixed capital
|
43
|
|
Indirect business taxes
|
50
|
|
Compensation of employees
|
369
|
|
Rents
|
12
|
|
Interest
|
15
|
|
Proprietors' income
|
52
|
|
Corporate income taxes
|
36
|
|
Dividends
|
24
|
|
Undistributed corporate profits
|
22
|
|
|
|
ANSWER: Before scrolling down, pick up some paper and a pencil
and actually calculate GDP. DOING it yourself is better than
reading it.
.
.
.
|
NI = Wages + Rents + Interest + Corp.
Profits + Prop. Income
|
.
.
From the table we get:
|
NI
|
=
|
Wages
|
+
|
Rents
|
+
|
Interest
|
+
|
Corp. Profits
|
+
|
Proprietor's Income
|
|
NI
|
=
|
369
|
+
|
12
|
+
|
15
|
+
|
82
|
+
|
52
|
NI = Wages + Rents + Interest + Corp. Profits +
Prop. Income
Corporate profits are used for three different
purposes:
- Corporate income taxes = 36
- Dividends = 24
- Undistributed corporate profits = 22
Corporate profits then equal 36 + 24 + 22 = 82 . On the
exams I will give you "corporate profits".
NI = 369 + 12 + 15 + 82 + 52 = $ 530
GDP = C + I + G + Xn = 400 + 128 + 88 + 7 = $
623
As you can see, National income does not equal GDP. There
are some expenditures (that are included in the expenditures
approach) that are not income (therefore not included in the
income approach). They are indirect business taxes ( 50),
depreciation (43), and net foreign income factor ( 0 ), But,
again, you won't have to do this in this course.
Other Social Accounts
Net Domestic Product (NDP)
National Income (NI)
|
NI = Wages + Rents + Interest + Corporate
Profits + Proprietor's Income
|
NI is income EARNED by the factors of production
(resources).
Personal Income (PI)
PI is the income RECEIVED by the factors of
production (resources). To calculate, take NI minus payroll
taxes (social security contributions), minus corporate
profits taxes, minus undistributed corporate profits, and
add transfer payments.
Disposable Income (DI) is your SPENDABLE income. DI
is personal income minus personal taxes.
The Real World - the 2007 United States GDP:
REVIEW:
|
7-8 (Key Question) Below is a list of domestic
output and national income figures for a given year. All
figures are in billions. The ensuing questions ask you to
determine the major national income measures by both the
expenditure and income methods. Answers derived by each
approach should be the same.
a. Using the above data, determine GDP and
NDP by the expenditure method.
b. Calculate National Income (NI) by the income
method.
|
Personal consumption
expenditures..............
Net foreign factor income earned
Transfer payments...........................
Rents
Consumption of fixed capital
(depreciation).......
Social security contributions
Interest.......
Proprietors’ income
Net
exports..........................................
Dividends (part of corporate profits)
Compensation of employees.............
Indirect business taxes
Undistributed corporate profits (part of
profits)....
Personal taxes
Corporate income taxes (part of corporate
profits)....
Corporate profits
Government purchases........
Net private domestic investment
Personal saving.......
|
....$245
4
....12
14
....27
20
....13
33
.....11
16
....223
18
....21
26
....19
56
......72
33
.......20
|
ANSWERS:
a. Using the above data, determine GDP and
NDP by the expenditure method.
GDP = $388
GDP = C + Igross + G + Xn
Igross = Inet + depreciation = 33 + 27 = 60
GDP = 245 + 60 + 72 + 11 = 388
NDP = $361
NDP + C + Inet + G + Xn
NDP = 245 + 33 + 72 + 11 = 361
or
NDP = GDP - depreciation
NDP = 388 - 27 = 361
b. Calculate National Income (NI) by the income
method.
NI = $339
NI = wages + rents + interest + profits
profits = corporate profits + proprietor's
income
profits = 56 + 33 = 89
NI = 223 + 14 + 13 + 89 = 339
|
GDP and Economic Well-Being
GDP per capita is often used to measure a country's well being or
standard of living. The higher the GDP per capita for a country the
better off the country is. But there are some problems with using GDP
per capita to measure a country's standard of living.
Problems with using GDP to Measure the Standard of
Living:
1. non-market transactions are not included in GDP
2. leisure increases the standard of living but it isn't
counted
3. improved product quality often isn't accounted for in GDP
4. GDP does not account for the composition output
5. GDP does not account for the distribution of output
6. increases in GDP may harm the environment and decrease the
standard of living
7. the underground economy produces goods and services but they
are not included in GDP
8. GDP does not account for a possible future decline in output
due to resource depletion.
9. Noneconomic Sources of Well-Being like courtesy, crime
reduction, etc., are not covered in GDP.
10. We must use per capita GDP to compare the living
standards of different countries.
1. non-market transactions are not included in GDP
GDP doesn’t measure some very useful output
because it is unpaid (homemakers’ services, parental child
care, volunteer efforts, home improvement projects). Called
non-market transactions
2. leisure increases the standard of living but it isn't
counted
GDP doesn’t measure improved living conditions as
a result of more leisure.
3. improved product quality often isn't accounted for in
GDP
GDP doesn’t measure improvements in product
quality unless they are included in the price
4. GDP does not account for the composition of output
GDP makes no value adjustments for changes in the
composition of output. Nominal GDP simply adds the dollar
value of what is produced; it makes no difference if the
product is a semiautomatic rifle or a jar of baby food.
5. GDP does not account for the distribution of output
GDP makes no value adjustments for changes in the
distribution of income. Per capita GDP may give some hint
as to the relative standard of living in the economy; but GDP
figures do not provide information about how the income is
distributed.
6. increases in GDP may harm the environment and decrease the
standard of living
- The harmful effects of pollution are not deducted from GDP
(oil spills, increased incidence of cancer, destruction of
habitat for wildlife, the loss of a clear unobstructed
view).
- GDP does include payments made for cleaning up oil spills
and the cost of health care for cancer victims.
7. the underground economy produces goods and services but they
are not included in GDP
GDP does not include output from the Underground
Economy. Illegal activities are not counted in GDP
(estimated to be around 8% of U.S. GDP). Legal economic
activity may also be part of the “underground,”
usually in an effort to avoid taxation.
Illegal activities are not counted in GDP (estimated to be
around 8% of U.S. GDP).
Legal economic activity may also be part of the
"underground," usually in an effort to avoid taxation.
8. GDP does not account for a possible future decline in output
due to resource depletion.
9. Noneconomic Sources of Well-Being like courtesy, crime
reduction, etc., are not covered in GDP.
10. We must use per capita GDP to compare the living
standards of different countries.
Which country has a higher GDP, Switzerland or India?
Which has a higher level of economic well-being:
- Switzerland:
- GDP: $239.3 billion (2003 est.)
- Population: 7,450,867 (July 2004 est.)
- GDP per capita: $32,700 (2003 est.)
- India:
- GDP: $3.033 trillion (2003 est.)
- Population: 1,065,070,607 (July 2004 est.)
- GDP per capita: $2,900 (2003 est.)
GDP
per capita = GDP / population
REVIEW:
|
Do each of the following cause GDP to OVERSTATE the
economic well-being of a country or UNDERSTATE
it?
1. non-market transactions (Does GDP
OVERstate or UNDERstate economic well-being?)
not included so, GDP UNDERstates
well-being.
2. improved product quality (Does GDP
OVERstate or UNDERstate economic well-being?)
not accounted for, so GDP UNDERstates
well-being.
3. more leisure (Does GDP OVERstate or
UNDERstate economic well-being?)
not accounted for, so GDP UNDERstates
well-being.
4. the composition of output (Does GDP
OVERstate or UNDERstate economic well-being?)
if "bad" things are being produced, then
GDP OVERstates well-being.
5. the distribution of income (Does GDP
OVERstate or UNDERstate economic well-being?)
an unequal distribution of income would
result in GDP OVERstating the well-being of most of
a country's population
6. the underground economy (Does GDP
OVERstate or UNDERstate economic well-being?)
not accounted for, so GDP UNDERstates
well-being
7. GDP and the environment (Does GDP
OVERstate or UNDERstate economic well-being?)
harmful effects of pollution and costs of
pollution reduction are not deducted from GDP, so
GDP OVERstates well-being.
8. Non-economic sources of well-being (Does
GDP OVERstate or UNDERstate economic well-being?)
not accounted for, so GDP UNDERstates
well-being
9. Resource depletion (Does GDP OVERstate or
UNDERstate economic well-being?)
GDP overstates well-being since when we
are depleting the resources our GP is high, but in
a future with fewer resources GDP will be lower
10. per-capita income (Does GDP OVERstate or
UNDERstate economic well-being?)
GDP OVERstates well-being in countries
with large populations and UNDERstates well-being
in countries with small populations
|
Measuring the Price Level and real GDP
Introduction
We've been using the AS - AD model to understand the macroeconomy.
The vertical axis measures the PRICE LEVEL which is the average level
of prices in an economy. The horizontal axis measures REAL DOMESTIC
OUTPUT which is all the goods and services produced in an
economy.
But WHAT NUMBERS do we put on the axes? How do we measure the
price level and real domestic output?
We have seen that we measure real domestic output with REAL GDP
and we have learned how to calculate GDP. In the lecture
on unemployment and inflation we learned how a PRICE INDEX is
used to measure the price level. Now we will learn how to use a price
index to calculate REAL GDP.
Nominal GDP and real GDP
Nominal GDP is the market value of all final goods and
services produced in a year. Nominal GDP is a (P x Q) figure
including the quantity of every item produced in the economy in
one year times its price THAT year.
Nominal GDP is calculated using the current prices prevailing
when the output was produced but real GDP is a figure that has
been adjusted for price level changes.
Nominal GDP = SUM (this year's prices x this year's quantities)
=
(P this year x
Q this year)
Therefore, if nominal GDP increases is it because we are
producing more (  Q this year ) or is it because the
Price Level increased (
P this year) ?
Q this year ) or is it because the
Price Level increased (
P this year) ?
In fact it is possible for nominal GDP to increase even though
the quantity produced has DECREASED. How?
Nom. GDP =
(P this year x
Q this year)
IF prices increased a lot, nominal GDP would increase even if
the quantity produced went down.
(P this year  x Q this year
  )
=
Nom. GDP
)
=
Nom. GDP
So if we know that nominal GDP has increased, we still do not
know if we are producing more (and reducing scarcity) or if the
price level has just increased.
Real GDP is a measure of how much was actually produced. That
is why it is used on the AS/AD graph as a measure of real domestic
output (RDO). We measure RDO with real GDP, not nominal GDP.
We calculate real GDP by summing the quantity produced of
everything in an economy times ITS PRICE IN A BASE YEAR. Since we
always use the same base year prices if the quantity produced
increases it will increase real GDP.
Real GDP = SUM (base year's prices x this
year's quantities) =
P base year x
Q this year
By using the same price level (base year prices) we remove the
effects of a higher price level (inflation) and if REAL GDP
increases we know that the economy is producing more and scarcity
is being reduced.
real GDP
- real GDP = SUM P base year x Q specific
year
- specific year's quantities x base years prices
|
Real GDP = SUM (base year's prices x this
year's quantities) =
P base year x
Q this year
By using the same price level (base year prices) we
remove the effects of a higher price level (inflation)
and if REAL GDP increases we know that the economy is
producing more and scarcity is being reduced.
|
Calculating a price index
To measure the price level we use a price index. A price index is
a measure of the price level as a percent of the price level in a
BASE year. This is different from inflation which is the rate of
increase in the price level from the PREVIOUS year.
As you have read, to calculate a price index a year is selected as
a base year. The average level of prices for that year is assigned a
value of 100. Then the price levels for all other years are
calculated as a percent of the base year.
GDP Price Index
definition
a price index is a measure of the price of a
specified collection of goods and services, called a "market
basket", in a given year as compared to the price of an
identical (or highly similar) collection of goods and
services in a reference year (called the "base year")
calculating a GDP price index
price index in a given year = (price of market
basket in a specific year / price of same market basket in
base year) x 100
calculating real GDP
real GDP = Nominal GDP / Price Index
Actually, you then need to multiply it by 100.
real GDP = (Nominal GDP / Price Index) x 100
|
The following data show nominal GDP and the
appropriate price index for several years.
Compute real GDP for each year. In which year(s) was
there a recession (decline in real GDP)?. All GDP are
in billions.
Nominal
Price level
Year
GDP
index
Real GDP
1
$117
120
___
2
124
104
___
3
143
85
___
4
149
96
___
5
178
112
___
6
220
143
___
The answers are below:
ANSWERS:
Nominal
Price level
Year
GDP
index
Real GDP
1
$117
120
$ 98
2
124
104
119
3
143
85
168
4
149
96
155
5
178
112
159
6
220
143
154
|
Textbook, questions 7-13 ANSWERS
(a) Interest on an AT&T bond. Included.
- Income received by the bondholder for the services derived by the
corporation for the loan of money.
(b) Social security payments received by a retired
factory worker. Excluded. - A transfer payment from taxpayers
for which no service is rendered (in this year).
(c) The services of a family member in painting the
family home. Excluded. - Not a market transaction. If any
payment is made, it will be within the family.
(d) The income of a dentist. Included. -
Payment for a final service. You cannot pass on a tooth
extraction!
(e) The money received by Smith when she sells her
economics textbook to a book buyer. Excluded. - Secondhand
sales are not counted; the textbook is counted only when sold for the
first time.
(f) The monthly allowance a college student
receives from home. Excluded. - A private transfer payment;
simply a transfer of income from one private individual to another
for which no transaction in the market occurs.
(g) Rent received on a two-bedroom apartment.
Included. - Payment for the final service of housing.
(h) The money received by Josh when he resells his
current-year-model Honda automobile to Kim. Excluded. - The
production of the car had already been counted at the time of the
initial sale.
(i) The publication of a college textbook.
Included. - It is a new good produced for final
consumption.
(j) A 2-hour decrease in the length of the
workweek. Excluded. - The effect of the decline will be
counted, but the change in the workweek itself is not the production
of a final good or service or a payment for work done.
(k) The purchase of an AT&T corporate bond.
Excluded. - A noninvestment transaction; it is merely the
transfer of ownership of financial assets. (If AT&T uses the
money from the sale of a new bond to carry out an investment in real
physical assets that will be counted.)
(l) A $2 billion increase in business inventories.
Included. - The increase in inventories could only occur as a
result of increased production.
(m) The purchase of 100 shares of GM common stock.
Excluded. - Merely the transfer of ownership of existing
financial assets.
(n) The purchase of an
insurance policy. Included. - Insurance is a final service. If
bought by a household, it will be shown as consumption; if bought by
a business, as investment—as a cost added to its real investment
in physical capital.