This chapter provides an introductory look at the macroeconomic problems of unemployment and inflation. We will study economic growth in greater detail in two weeks when we study chapters 8 and 22 Web.
Review: The three macroeconomic issues are:
Review: The Business Cycle
Unemployment, inflation and economic growth tend to change cyclically over time.
The four phases of the business cycle:
1. A peak is when business activity reaches a temporary maximum, unemployment is low, inflation high.2. A recession is a decline in total output, unemployment rises and inflation falls.
3. The trough is the bottom of the recession period, unemployment is at its highest, inflation is low.
4. expansion (recovery) is when output is increasing, unemployment begins to fall and later inflation begins to rise.
Unemployment increases during business cycle recessions and decreases during business cycle expansions (recoveries). Inflation decreases during recessions and increases during expansions (recoveries).
Review: Maximizing Satisfaction
The primary reason to study unemployment is that it contributes to scarcity. Scarcity always exists since resources are limited and human wants are unlimited. There are five ways to reduce scarcity - the five Es of economics (see diagram below). Full employment is one of the five Es. We defined full employment as "using all available resources". If a society uses ALL AVAILABLE RESOURCES then more goods and services will be produced and scarcity will be reduced
Another way to illustrate the effects of unemployed resources is with the production possibilities curve (see graph below). Point "D" illustrates the effect of unemployment. Points "A", "B", and "C" represent the maximum possible levels of production WITH FULL EMPLOYMENT. With unemployment, less will be produced (point "D").
Finally, we have illustrated unemployment before using the AS-AD model.
If the equilibrium level of output is less than the full employment level as illustrated on the graph above, this indicates that some available resources are unemployed and less is being produced.
The unemployment rate in the United States was 4.5% in February, 2007 and 9.8% in September, 2009. Whenever we see a "%" we have to ask "percent of what?" In February of 2007 4.5% of what was unemployed?
|
Unemployment From where do the statistics come? [The following is from: http://stats.bls.gov/cps/cps_faq.htm ] Many people think that the unemployment rate is a measure of who is receiving an unemployment insurance check, in fact, it includes many more people than that. Because unemployment insurance records relate only to persons who have applied for such benefits, and since it is impractical to actually count every unemployed person each month, the Government conducts a monthly sample survey called the Current Population Survey (CPS) to measure the extent of unemployment in the country. The CPS has been conducted in the United States every month since 1940 when it began as a Work Projects Administration project. It has been expanded and modified several times since then. As explained later, the CPS estimates, beginning in 1994, reflect the results of a major redesign of the survey. The Unemployment Rate In September of 2000, the US unemployment rate was 3.9%
What is Unemployment?
Definition If the unemployment rate is 3.9%, then 3.9% OF WHAT are unemployed? It is NOT 3.9% of the population, but rather 3.9% of the LABOR FORCE. What is the labor force?
|
US unemployment rates:
|
The authors of our textbook divide the population into three groups:
|
"Employed" includes:
|
Not in the labor force:
|
Employed persons consist of:
[From http://stats.bls.gov/cps/cps_faq.htm
]
Unemployed persons are:
[From http://stats.bls.gov/cps/cps_faq.htm
]
Two factors cause the official unemployment rate to understate actual unemployment.
Calculating the Unemployment Rate
The unemployment rate is defined as the percentage of the labor force that is not employed. Note that it is NOT the percentage of the POPULATION.
To calculate the unemployment rate:
UE rate = (# unemployed / labor force) x 100
So using the data for 2007 above:
So the unemployment rate was:
(7.1 / 153.1) x 100 = 4.6 % of the labor force.
Full employment equals between 4 and 5 % unemployment !!!
As we discussed above, full employment results in reducing scarcity by producing the economy's potential level of output. The unemployment rate in 2007 was 4.5%, that amounts to about 71 million people unemployed. Remember that unemployed means not working but looking. So with 7.1 million people unemployed we still have FULL EMPLOYMENT!!
How can 4% to 5% unemployment be considered full employment?
How can 7.1 million people looking for work be called "full employment?
It depends on how we define full employment. We have defined full employment as using all available resources so as to achieve the potential level of output for an economy. Full employment is achieving the potential level of output. So, with some types of unemployment an economy can still produce its potential level of output.
Full employment means achieving the potential output
As we learned in our AS-AD lesson "potential output" is NOT the absolute maximum, but it is the potential level of output under normal circumstancesGraphically, the potential, or the full employment output can be illustrated three ways:
1) Points A, B, and C on the production possibilities curve represent a full employment of resources.
2) Equilibrium on the short run AD - AS graph below is at the full employment level of output.
3) potential output is the level of output on the long run aggregate supply curve.
Economists estimate that about 4 %to 5% unemployment is Full Employment. This is called the "full employment rate of unemployment", or the "natural rate of unemployment" and it includes structural and frictional unemployment
What? To understand how and economy with 4-5% unemployment can be achieving the potential level of output and therefore have "full" employment" , we must understand the three different types, or causes, of unemployment.
Types of Unemployment
To understand how we can achieve the potential level of output and still have 4.5 % unemployment we must understand the three types, or causes, of unemployment. The key to understanding what full employment means, is to consider what happens to output with each type of unemployment.
1. Frictional UnemploymentWHAT IS FRICTIONAL UNEMPLOYMENT?Frictional unemployment is the type of unemployment caused by workers looking for their first job, voluntarily changing jobs, and by temporary layoffs. It is unemployed workers between jobs. Frictional unemployment is "good" unemployment because without it the economy could not be producing as much as possible (i.e. achieving the potential level of output).HOW DOES FRICTIONAL UNEMPLOYMENT AFFECT SCARCITY?
How can the economy be achieving the potential level of output if some people are frictionally unemployed? First, frictional unemployment is NECESSARY in order for the economy is to achieve its potential level of output. For example, let's assume an engineering student has just graduated from college and is looking for a job. He/she is frictionally unemployed. Would society's scarcity be reduced as much as possible if that engineer takes the first job he/she finds? On the way home from graduation he/she sees a "HELP WANTED" sign, turns in, applies, and works the rest of his/her life at McDonald's. Is this good for society? OR would it be better for society if they NOT take that job at McDonald's and remain frictionally unemployed longer? We need some frictional unemployment to get resources to the jobs where they produce the most so some frictional unemployment actually reduces scarcity. To produce as much as possible with our limited resources we need some frictional unemployment.WHAT CAN THE GOVERNMENT DO TO REDUCE FRICTIONAL UNEMPLOYMENT?
Frictional unemployment tends to be short-lived, BUT we do not want it to last too long. If that engineer is unemployed for many years looking for just the right job, then there would be more scarcity than if he/she had taken the job at McDonald's. Therefore programs to keep it low would help reduce scarcity and governments have such programs like state employment offices and career placement offices at universities. These programs help people find jobs quicker so that more can be produced.2. Structural Unemployment
WHAT IS STRUCTURAL UNEMPLOYMENT?Structural unemployment is unemployment of workers whose skills are not demanded by employers. They are unemployed because they lack sufficient skill to obtain employment, or they cannot easily move to locations where jobs are available.Structural unemployment can result from changes in the structure of demand for labor; e.g., when certain skills become obsolete or geographic distribution of jobs changes.
HOW DOES STRUCTURAL UNEMPLOYMENT AFFECT SCARCITY?
Structural unemployment results from people not having the necessary skills. If these people are unemployed, what happens to scarcity? Nothing! Nothing happens to scarcity is they are unemployed because they don't have the skills needed to produce anything. Therefore we can still produce our potential level of output with our available resources even if there is structural unemployment. If resources without skills were put to work, they, by definition, couldn't produce anything because they don't have the skills.WHAT CAN THE GOVERNMENT DO TO REDUCE STRUCTURAL UNEMPLOYMENT?
But, do we want these workers to just do nothing? NO. We studied in the 5Es lesson that more workers or better workers results in economic growth. Economic growth is increasing out potential level of output. This is good for society since it also reduces scarcity. Therefore governments have economic growth programs to reduce structural unemployment like financial aid for school and job training programs.
3. Cyclical Unemployment
WHAT IS CYCLICAL UNEMPLOYMENT?Cyclical unemployment is a type of unemployment caused by insufficient total spending (or by insufficient aggregate demand). It is unemployment caused by the recession phase of the business cycle. If there is less aggregate demand firms respond by producing less. Output and employment are reduced. The extreme unemployment during the Great Depression (25 percent in 1933) was cyclical unemployment.HOW DOES CYCLICAL UNEMPLOYMENT AFFECT SCARCITY?
If there is a recession and therefore an increase in unemployment associated with a decrease in output, this results in more scarcity. This is not good for society since it will be producing at a point inside its production possibilities curve (point D on the graph below) or at a level of output short of the full employment level.
WHAT CAN THE GOVERNMENT DO TO REDUCE CYCLICAL UNEMPLOYMENT?
Therefore, governments have policies to reduce cyclical unemployment. These are the demand management policies discussed in our lesson on the AS-AD. Expansionary fiscal policies (increasing government spending or decreasing taxes) and easy money policies (increasing the money supply) are designed to increase AD, reduce cyclical unemployment, and and move the economy back to the full employment level of output. .
It is sometimes not clear which type of unemployment describes a person's unemployment circumstances.
So to repeat: economists estimate that about 4 %to 5% is Full Employment. This is called the "full employment rate of unemployment", or the "natural rate of unemployment" and it includes:
If there is some frictional and structural unemployment in the economy can the potential level of output still be achieved? YES, and economists estimate that there is between 4% and 5% frictional and structural unemployment in the US economy. that is why we are currently at, or below, full employment.
The "full employment rate of unemployment" is the unemployment rate occurring when there is no cyclical unemployment and the economy is achieving its potential output
Changes in the Full Employment (Natural) Rate of Unemployment
The natural rate of unemployment is not fixed but depends on the demographic makeup of the labor force and the laws and customs of the nations. in the United States in the 1060s the full employment rate of unemployment was around 4%. this was the target of President Kennedy's tax cut program In the 1970s the full employment rate of unemployment was around 5%. and it was about 6% in the 1980s.
Why did the full employment rate of unemployment increase? Or, another way of saying this is "why did the amount of frictional and structural unemployment increase?" There were several cultural and demographic changes during these decades that resulted in more frictional and structural unemployment. After World War II ended in the 1940s the baby boom began. By the 1960s this large increase in population was beginning to enter the labor force. As they begin looking for their first jobs they were frictionally unemployed. Also during these decades the roles of women were changing and more women entered the labor force for the first time (frictional unemployment) and many did not have the necessary skills (structural unemployment).
Recently the natural rate has dropped from 6% to 4 to 5%. This is attributed to (1) the aging of the work force with fewer new entrants reducing frictional unemployment, (2) improved job information through the internet and temporary-help agencies which also reduces frictional unemployment, (3) new work requirements passed by congress with the most recent welfare reform which encourage those who are frictionally unemployed to try to get a job quicker, and finally, (4) the doubling of the US prison population since 1985 has removed from the labor force a group of people who have a high rate of unemployment.
Costs of Unemployment
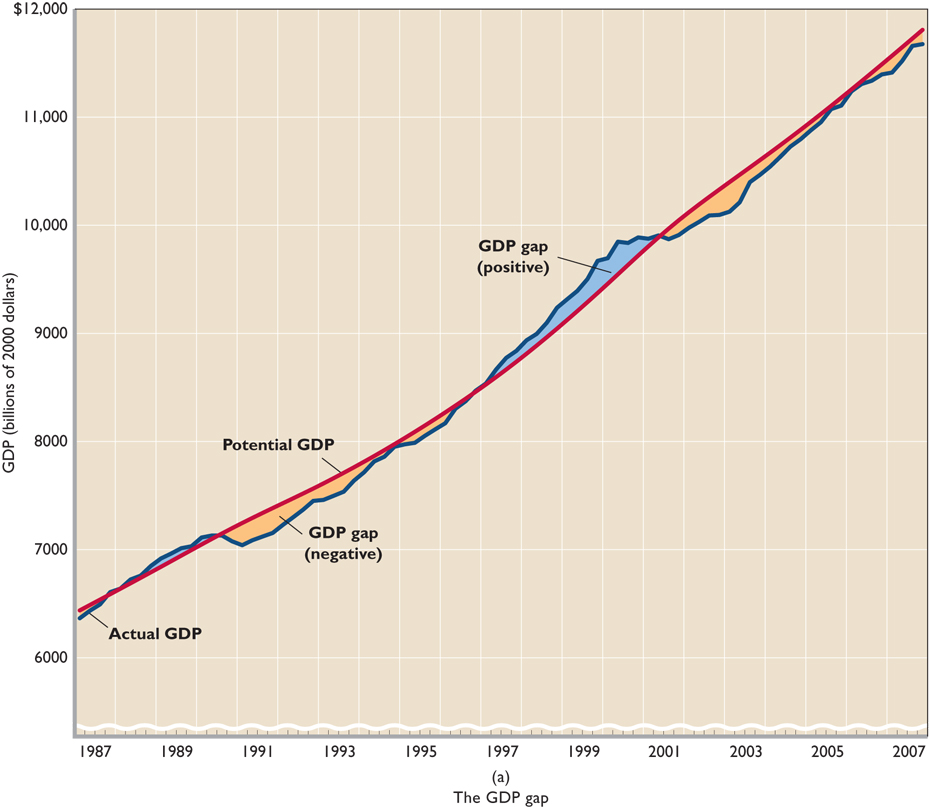
GDP gap
As we have discussed many times, the problem with unemployed resources is that they could have been used to produce more boats - - or cars or whatever it is that society wants. With unemployment there is more SCARCITY. This loss of goods that could have been produced if we had used all of our resources is called the GDP gap and it is a measure of the cost of unemployment.
GDP gap: The amount by which actual gross domestic product falls below potential gross domestic product. GDP stand for Gross Domestic Product. We will study how to measure GDP in chapter 6 next week. For now, GDP is a measure of how much is produced in an economy in a year.
If the GDP gap is negative then the potential GDP > the actual GDP and economy is not producing as much as possible. This is how much more output could have been produced if there was full employment. The GDP gap then is the lost output caused by not having full employment.
If the GDP gap is positive then the actual GDP is > the potential GDP. It is possible to have a positive GDP gap if AD is very high and it crosses the AS curve in the classical range BEYOND the full employment level of real domestic output. The result is high inflation.
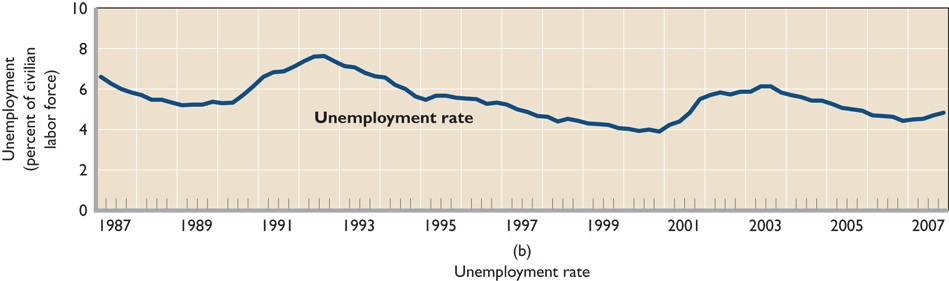
One way to measure this cost is with Okun's Law. Economist Arthur Okun quantified the relationship between unemployment and GDP as follows: For every 1 percent of unemployment above the natural rate, a negative GDP gap of about 2 percent occurs. This is known as "Okun's law." What this means is for every one percentage point decrease in the unemployment rate output increases about 2%. The larger increase in output is due to more people (discouraged workers) reentering the labor force. So a 1% decrease in unemployment really means that there are more than 1% more people working.
Non Economic Costs
There are also many non-economic costs associated with inflation. These costs include:
Unequal burdens of unemployment exist.
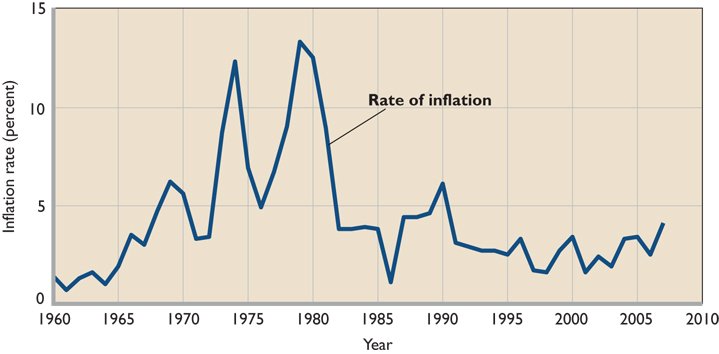
Measuring Inflation
Inflation is the annual rate of increase in the price level.
US inflation rates:
In January of 2007 the inflation rate was 2.1 %. But what does this mean? 2.1% of what? An inflation rate of 2.1% in January of 2007 means that the price level was 2.1% higher than it was in January of 2006. In the chapter on aggregate supply and aggregate demand we learned that the price level is "the average level of prices in the economy". We find the price level on the vertical axis of the AS-AD graph.
But how is the price level measured? What numbers would one put along the vertical axis? How can we measure the average level of prices in an economy? To do this economists use a "price index". In order to calculate inflation we need to know how the price level is measured, therefore we need to learn about a price index.
Measuring Inflation: Price index
Our textbook defines a price index in an index number which shows how the weighted average price of a “market basket” of goods changes over time. What does that mean? There are two price indices that we will use this semester. We will study the GDP Price Index in the chapter on measuring GDP (or real domestic output - RDO). To learn how to measure inflation we will use the CPI, the consumer price index.
The CPI is an index which measures the prices of a fixed “market basket” of over 200 categories of goods and services bought by a “typical” consumer in.
It works this way:
A list of over 200 items bought by the typical consumer is drawn up. The list is then "weighted" meaning that they do not include 1 car, 1, computer, 1 house, 1 pizza, one gallon of gasoline, etc. Instead they "weight" each item according to its share in the typical consumer's budget. Each month data collectors collect prices of each item in the "market basket" and an average price is calculated. The price of the market basket each month is compare to its price in a "base year". So the numbers in the CPI tell us the value of the market basket each year AS A PERCENT OF ITS VALUE IN A BASE YEAR The years 1982-1984 have been selected as "base year" and assigned the index number of 100 (see table at right)..
So, in 1988 the CPI was 118.3 which means that the price of the market basket in 1988 was 118.3% of what it was in the base year. Or the price was 18.3 % higher than in the base year.
[From http://www.bls.gov/cpi/cpifaq.htm]
Each month, BLS data collectors called economic assistants visit or call thousands of retail stores, service establishments, rental units, and doctors' offices, all over the United States to obtain information on the prices of the thousands of items used to track and measure price changes in the CPI. These economic assistants record the prices of about 80,000 items each month representing a scientifically selected sample of the prices paid by consumers for the goods and services purchased.
During each call or visit, the economic assistant collects price data on a specific good or service that was precisely defined during an earlier visit. If the selected item is available, the economic assistant records its price. If the selected item is no longer available, or if there have been changes in the quality or quantity (for example, eggs sold in packages of 8 when they previously had been sold by the dozen) of the good or service since the last time prices had been collected, the economic assistant selects a new item or records the quality change in the current item.
The recorded information is sent to the national office of BLS where commodity specialists who have detailed knowledge about the particular goods or services priced review the data. These specialists check the data for accuracy and consistency and make any necessary corrections or adjustments which can range from an adjustment for a change in the size or quantity of a packaged item to more complex adjustments based upon statistical analysis of the value of an item's features or quality. Thus, the commodity specialists strive to prevent changes in the quality of items from affecting the CPI's measurement of price change.
Year
CPI
1976
56.9 1977
60.6 1978
65.2 1979
72.6 1980
82.4 1981
90.9 1982
96.5 1983
99.6 1984
103.9 1985
107.6 1986
109.6 1987
113.6 1988
118.3 1989
124.0 1990
130.7 1991
136.2 1992
140.3 1993
144.5 1994
148.2 1995
152.4 1996
156.9 1997
160.5 1998
163.0 1999
166.6 2000 172.2 2001 177.1 2002 179.9 2003 184.0 2004 189.9 2005 195.3 2006 201.6 2007 207.3 2008 215.3
READ THE FOLLOWING THEN CLICK ON THE LINK BELOW AND LISTEN TO THE 5 MINUTE RADIO REPORT ON THE CPI
All Things Considered
National Public Radio
Wed., July 19, 2006"Shopping for the Consumer Price Index"
http://www.npr.org/templates/story/story.php?storyId=5568606
All Things Considered, July 19, 2006 · The Bureau of Labor Statistics today released the monthly Consumer Price Index, a key economic indicator that tracks inflation. To track prices, the Labor Department sends out hundreds of people around the country to monitor prices for everything Americans buy -- from tires to food and college tuition.
Robert Siegel went shopping with Caren Gaffney to find out how the Consumer Price Index is compiled. On the outing, Gaffney, a former telecommunications executive, checked prices in two grocery stores in the Washington, D.C., area. Siegel discusses the index with economists Mark Zandy of Moody's Economy.com, the Cleveland Federal Reserve's Michael Bryan and the University of Rochester's Mark Bils.
OPTIONAL- More info. on the CPI: http://stats.bls.gov/cpifaq.htm
OPTIONAL - how the CPI is measured: http://stats.bls.gov/cpifact2.htm
Calculating Inflation - - - - KNOW THIS !!!!!!
Since a price index measures the price level as a percent of a base year and inflation measures the change in the price index from the previous year, to calculate the inflation rate we use the following formula:
Inflation rt. for current year =
x 100
So to calculate the inflation rate for 1999 using the CPI data above:
Inflation rate for 1999 =
x 100
Inflation rate for 1999 =
x 100 = 2.2 %
For fun try these online inflation calculators:
USING A PRICE INDEX
THE PRICE OF GASOLINE:March of 1981: $1.66; CPI = 88.5 (base year: 1982-84)
April of 2005: $2:30; CPI = 192
When did gasoline cost more?
- http://data.bls.gov/cgi-bin/cpicalc.pl
- http://www.westegg.com/inflation/
- http://www.aier.org/colcalc.html
How the Cost-of-Living Calculator Works This calculator uses the Consumer Price Index (1982-84=100) and the following simple formula to convert dollar amounts between two different years.
Converted$ = (StartYear$ / StartYearCPI) * ConvertYearCPI
Any time you compare dollar amounts over time, the amounts should be adjusted for price inflation. With this calculator, you can compare the real buying power of any dollar amount you enter in the box. For example, $100 in 1913 had the same buying power as $1,584.85 in 1996.
The Rule of 70 - - - - KNOW THIS !!!!!!
The rule of 70 is a quick way to estimate how long it will take for something (like prices) to double if you know the annual percentage increase (like inflation).
To determine the number of years it will take for the price level to double; divide 70 by the annual rate of inflation.
|
|
|
|
approximate number of years to double = |
|
|
|
For example, if the inflation rate is 3%, it will take 23 1/3 years for prices to double.
|
|
|||
|
approx. number of years to double = |
|
= |
23.33 years |
|
|
This handy little rule can be used for many things.
If the population of a country is growing at a rate of 1% a year (which is about the population growth rate of the United States), how many years until the population doubles?
|
|
|||
|
approx. number of years to double = |
|
= |
70 years |
|
|
What if the population growth rate is 4 % a year?
approx. number of years to double =
= 17.5 years
Types / Causes / Theories of Inflation
Demand-Pull inflation
 Demand-pull inflation is inflation caused by too much spending (and increase in AD).
Demand-pull inflation occurs when spending (AD) increases faster than production (AS).I
There is not demand pull inflation every time AD increases. If AD crosses AS in the Keynesian range of the AS curve (AD1 and AD@ in the graph below) then an increase in AD will not cause an increase in the price level and there will be no inflation. If AD increases in the intermediate range or the Classical range the result will be a rising price level and inflation.
Cost-push (or supply-side) inflation
Cost-push or supply-side inflation caused by reductions in aggregate supply. The main causes of cost-push inflation are (1) "wage-push" as result of union strength and (2) supply shocks that may occur with unexpected increases in the price of raw materials.
Effects of Inflation
There are two major effects of inflation. "Redistributive effects" means that inflation affects different groups differently. Some people are hurt by inflation and some people are helped by inflation. The "output effects" of inflation include its impact on how much is produced in an economy.
Redistributive effects of inflation:
Output Effects of Inflation
Demand-pull inflation has a stimulus effect on the economy resulting in greater output. See graph below.
Cost-push inflation has a contractionary effect resulting in less output.
Hyperinflation is a very rapid rise in the price level. It results in LESS OUTPUT because:
- people no longer will accept money since it is losing its value very quickly
- they will therefore either
- barter, or
- produce everything for themselves
- Therefore, society will not benefit from the gains in output caused by specialization and exchange (trade) and LESS WILL BE PRODUCED.