The Economic Problem: Making Choices
We've already discussed scarcity and the necessity of making choices in an earlier lecture [5es.htm]. Here we begin looking at the consequences of making choices. We'll begin by looking at economic resources (since this is where it all begins, we probably should have began there). Then we'll introduce our first model (the production possibilities graph) and use it to illustrate (1) the necessity of making choices and (2) some of the consequences

Limited Resources: The Four Factors of Production
What is a resource?
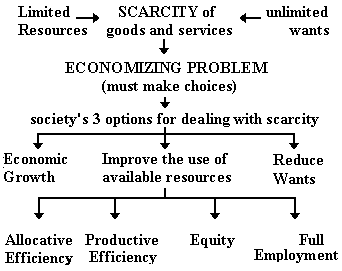
How would you define the term "resource"? Our diagram of scarcity will give us a clue:

Resources are those things we use to produce the things we want.
Types of Resources
Our multimedia lecture identifies three types of resources (1) land, (2) labor, and (3) capital. Some economists identify a special, and important type of labor: (4) the entrepreneur.
1. Land
Land is one of those words in economics that has a different meaning than in the real world. Examples of "land" would include lakes, rivers, oceans, iron ore, crude oil, and the land beneath our feet. A definition would be "non-human natural resources. Why don't we just call them natural resources? that would be too easy.
2. Capital
Examples of "capital "include machinery, tools, highways, and factories. Note that capital in economics does not mean not "money". When you hear someone say, "we need to raise enough capital (money) to start a new business". They are using a different definition of the term "capital".
Is money a resource? NO. If resources are those things that we use to produce the goods and services we want, then what do we make out of money? I guess you could use it to wallpaper a room, or if you bleach all the ink off of money you could make a notepad.
Capital, then, is a manufactured resource - something that you produce and use it to produce something else.
3. Labor
I think we all know what labor is.
4. Entrepreneurial Ability
The entrepreneur is a very important type of resource. Without the entrepreneur, we would not get any goods or services. The entrepreneur does four things:
Without the entrepreneur all the other resources just lie around and do nothing. For example, Russia has much "land" (natural resources). They have a fairly well educated labor force. and a pretty good capital infrastructure ("good" compared to many countries, but rapidly deteriorating). What Russia is lacking are entrepreneurs. People with the ideas and abilities to put hose ideas into action. Soon after the collapse of communism, the US sent Peace Corps volunteer to Russia, volunteers with MBAs (Masters of Business Administration) and/or business experience.
Now take this short quiz: Resource Quiz
Resources and Resource Payments
Since resources are limited they command a payment. The payment for each type of resource has it's own term.
1. land -- rent
2. capital -- interest
3. labor -- wages
4. entrepreneurial ability -- profits or losses
Demonstrating the Necessity of Choice -- Production Possibilities Frontier (Curve)
The Economizing Problem
Scarcity exists because of :
1. Unlimited Wants
2. Limited resources
Because of scarcity we must make choices

There are three fundamental questions that all societies face because of scarcity:
Our textbook does a good job discussing the production possibilities curve. I will just highlight a few points here.
Production Possibilities Table
The production possibilities table and curve (or frontier) shows the MAXIMUM POSSIBLE LEVELS OF PRODUCTION.
The graph is based on the following assumptions which "simplify " the real world:
1) fixed resources
The quantity of resources does not change.2) fixed technology
There are no new technological discoveries while we use the graph.
These first two assumptions taken together means that there is no economic growth. We said in an earlier lecture that economic growth is caused by:
- more resources
- better resources
- better technology
3) productive efficiency
Businesses produce at a minimum cost. This means that they are producing as much as they can with the resources available.4) full employment
All available resources are employed (not just labor). This also means that businesses are producing as much as they can.
Our authors use the term "full production" to mean both productive efficiciency and full employmet. It means that we are producing as musch as we can with the resources we have (hence "full production").5) only two goods
To really make the model simple, we'll assume that only two goods are being produced. In this online lecture we'll assume that the economy only produces ROBOTS (industrial robots like they use in a factory, not R2D2 or Three- CPO) and WHEAT, or wheat bread.
Given these assumptions, let's assume that we have the following data.
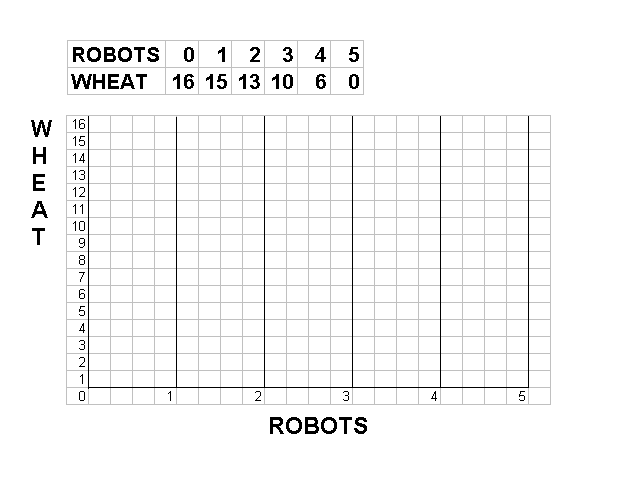
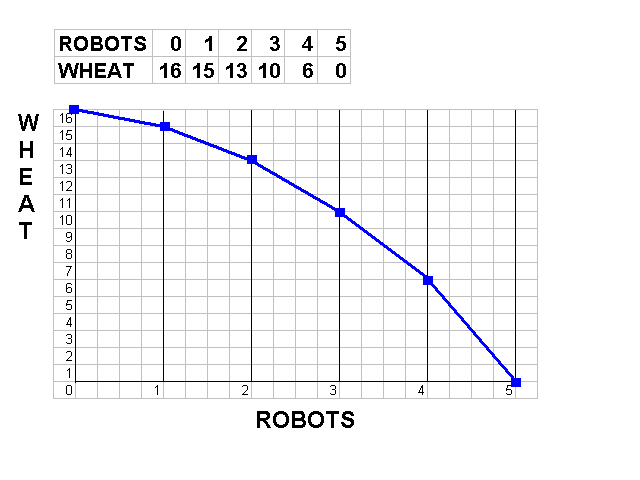
Each combination of robots and wheat (0R and 16W, or 1R and 15 W, or 2R and 13 W, etc.) is the maximum combination that can possibly be produced given our five assumptions.
This data can be graphed giving us a production possibilities curve (PPC).
Demonstrating the Necessity of Choice
We can use the production possibilities model to demonstrate many important and fundamental economic principles.
The PPC can demonstrate the fact that because of scarcity, we must make choices. A point outside the PPC (like point A) is unattainable.
. 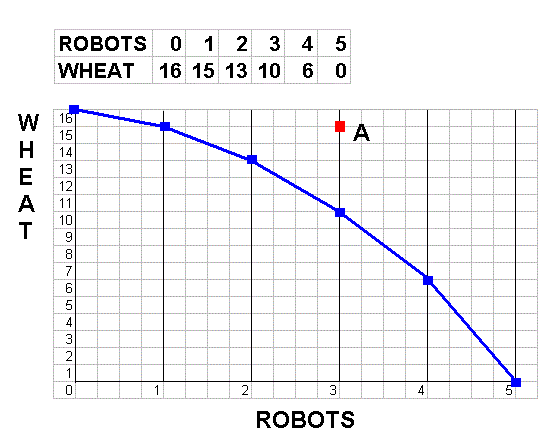
Given our assumptions, this economy cannot produce at point A. As we learned in our lesson on graphing, any point on a graph represents two numbers. Point A then represents 15 Wheat and 3 Robots. This combination (15W and 3 R) is impossible to produce given our assumptions. Above we said the MAXIMUM that could be produced was (15 W and 1 R) or (3 W and 10 R). So we have to make a choice. Or as I would say: "We can't have all the boats we want."
The PPC clearly demonstrates the necessity of choice.
We can use the PPC model to demonstrate other fundamental concepts in economics:
Opportunity Costs
First, ALL costs in economics are opportunity costs. Economists always mean "opportunity costs" whenever they use the term "cost".
The opportunity cost of any decision is the value of the NEXT BEST ALTERNATIVE that is NOT CHOSEN. Opportunity costs measure what you "give up" when you make a decision.
Examples:
Calculating Opportunity Costs
Use the PPC below to calculate the opportunity cost of each Robot.

The FIRST Robot cost us how much Wheat? Answer: 1W.
If we are producing 16W than we can't produce any Robots (16W and
0R). When we produce our first Robot, Wheat production drops from 16W
to 15 W. So the first Robot costs 1W.
The SECOND Robot costs how much? Answer: 2W (not 3W)
If we are producing 1R then we can produce 15W. When we produce our
second Robot, Wheat production drops from 15W to 13 W. So the second
Robot costs 2W. (The first two Robots together cost 3W.)
The THIRD Robot costs how much? Answer: 3W
If we are producing 2R then we can produce 13W. When we produce our
third Robot, Wheat production drops from 13W to 10 W. So the second
Robot costs 3W.
The FOURTH Robots costs 4W.
The FIFTH Robot costs 6W.
Law of Increasing Costs
The Production Possibilities Model and also demonstrate the Law of Increasing Costs.
Definition
As you increase production of one product (like Robots), INCREASING amount of another product (like Wheat) must be given up. Above we calculated the cost of producing the first Robot as 1W, the second Robot cost 2W, the third Robot 3W, the fourth robot 4W, and the fifth Robot 6W.
Note how the costs INCREASE for each ONE additional Robot being produced. this is because of the law of increasing costs.
Shape of the PPC -- concave
The bowed-out SHAPE of the PPC is a result of the law of increasing costs. We call this shape "concave to the origin".
Rationale
Why is the law of increasing costs true? Why is the PPC concave to the origin (bowed out)? Why does it cost more to produce the second Robot than to produce the first assuming that the Robots are identical? It makes sense that producing two Robots will cost more than producing one Robot, but why does producing the SECOND Robot (just the second ONE Robot) cost more than producing the FIRST (one) Robot. Or, why does producing two Robots cost MORE THAN TWICE AS MUCH and producing one?
The first robot cost 1W. The Second Robot cost 2W. Producing TWO Robots cost 3W. Why is the law of increasing cost true?
The rationale is quite simple. Not all resources are the same. some resources are better at producing Wheat (like farmers) and some resources are better at producing robots (like engineers). so when we produce 16W and 0R, ALL of our resources (farmers and engineers) are producing wheat.
When we decide to produce the first Robot, we take the best engineers from the wheat fields and put them in the robot factory. Since these engineers are very good at producing Robots we don't need very many of them and Wheat production goes down only a little (we lose only 1W).
When we decide to produce the second Robot we need to shift more engineers from the wheat fields, but now all the best engineers are already in the robot factories and we need to take the second-best engineers, and MORE OF THEM, to produce just one more Robot. So Wheat production goes down more than when we produced the first Robot.
If we are producing 4R and 10 W, all of our best farmers are in the wheat fields. To produce one more Robot (the fifth) we need to take all of these farmers and put them in the robot factories, because they are not very good at making Robots. so we get one more robot, but we lose a lot of Wheat (6W).
The law of increasing cost is true because resources not not all the same. Some are better at producing Wheat and some are better at producing Robots.
Unemployment
How unemployment increases scarcity (see the 5Es lesson) can be demonstrated with the production possibilities model.

Point be represents 6W and 2R. This is less than the maximum that can be produced with our resources. We can produce 13W and 2R or 6W and 4R. If there are unemployed resources we produce LESS than the maximum possible. this increases scarcity.
Productive Inefficiency
Ina previous lesson (see 5Es) we stated that productive inefficiency causes scarcity because less is produced. On our PPC this could be represented by point B.

Economic Growth
In Macroeconomics we study three main issues:
We can use the production possibilities model to demonstrate how economic growth can reduce scarcity.
Our multimedia lesson use several definitions of economic growth. let me review them here.
Three Definitions of Economic Growth
(1) Increasing our POTENTIAL OUTPUT
I like to call this increasing our ABILITY to Produce. this is the definition we used in the 5Es lesson. This is the most fundamental definition of economic growth. It is the type of economic growth used on out 5Es diagram.
We can increase our ABILITY to produce goods and services (or increase our POTENTIAL GDP) if we get:
- more resources
- better resources, and
- better technology
Since this increase maximum output that we are able to produce it shifts the PPC outward. On the graph below, economic growth would cause the PPC to move from PP1 to PP2.
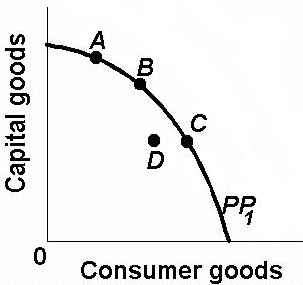
This doesn't necessarily mean that the economy IS producing more, just that it CAN produce more. To achieve our new potential levels of output we also need full employment and productive efficiency. It could be possible to have this type of economic growth so that we CAN produce the quantities represented by point E, but if there is unemployment and productive inefficiency we would be at a point beneath this new curve (maybe point C). So we may get new resources or new technology so we CAN produce more (point E on PP2), but if we don't use the new resources (i.e. we have unemployment) or if we don't use the new technology (i.e. we have productive inefficiency) , we may remain on PP1 (point C).
(2) Increasing Output
The most commonly used definition of economic growth is simply producing more. (Later we will call this INCREASING REAL GDP.)When an economy increases its output it is often said to have achieved economic growth. But if by producing more we are simply ACHIEVING OUR POTENTIAL, then we could also say that it is REDUCING UNEMPLOYMENT or ACHIEVING PRODUCTIVE EFFICIENCY. On our graph this would be represented by moving from point D to a point on the curve: A, B, or C).
(3) Increasing Real GDP per capita
The definition of economic growth used in our multimedia lesson on economic growth (Macro_015.les) is an increase in GDP per capita. This means increasing output per person. GDP per capita is calculated by dividing output by the population.
A Shrinking PPC?
Is it possible for a country's PPC to shrink?
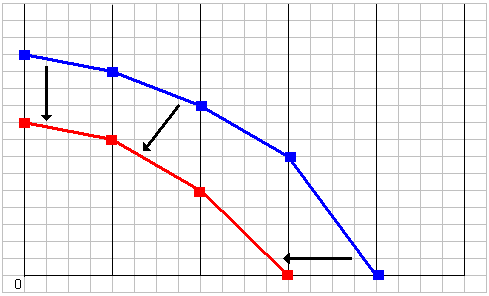
Yes, but how? We already know that economic growth is caused by:
- more resources
- better resources, and
- better technology
Then the PPC can DECREASE if we have FEWER RESOURCES. This could be caused by war, famine, environmental degradation, and numerous other causes.
Nonproportional Growth
Present Choices, Future Possibilities
How much we can produce in the future depends on WHAT we produce today. if economic growth is caused by:
- more resources
- better resources, and
- better technology
Then if we use our resources TODAY to produce more capital (manufactured resources), we will have more resources in the future so we will be able to produce more goods and services.
Which point on the graph below, A, B, or C, would give this economy the greatest potential (most economic growth) in the future? Which point produces the most capital resources?

Remember, any point on a graph represents two numbers. Point A represents the more capital goods than the other points, so if we produce at point A we will get more future growth. But this comes at a cost (opportunity cost). Point A represents more capital goods, but LESS CONSUMER GOODS.
Since World War II, the country of Japan has been operating near point A on its PPC. Japan has been producing a lot of capital good and has achieved much economic growth. The cost of this growth is fewer consumer goods. The average Japanese income is about the same as that in the US, but they have fewer consumer goods in their homes.
Since World War II, the United States has been operating closer to points B or C on its PPC. We have been producing and consuming many consumer goods, but we have not been adding to our stock of capital resources as quickly as we could.
The choices we make today affect how much we are able to produce in the future.
Optimum Product Mix? (Allocative Efficiency?)
Which point is "best" for society, A, B or C? By "best" we mean which combination will maximize our satisfaction by achieving allocative efficiency? We discussed allocative efficiency in our 5Es lesson.)

THE QUESTION CANNOT BE ANSWERED. Many students select point B because it is in-between the other two, but the production possibilities model is not designed to demonstrate allocative efficiency. Allocative efficiency depends on what the people want. If Americans want more consumer goods and if the Japanese want more economic growth then both points C and A could be allocatively efficient. In our lesson on graphing we said that economic models are abstractions and are designed to demonstrate some, but not all, issues.
[top]