Review: Macroeconomic Issues
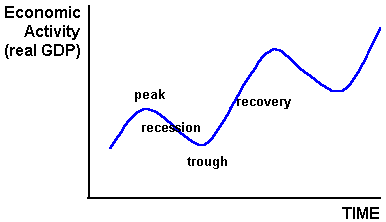
Review: The Business Cycle

Unemployment increases during business cycle recessions and decreases during business cycle recoveries. Inflation decreases during recessions and increases during recoveries.
Review: Maximizing Satisfaction
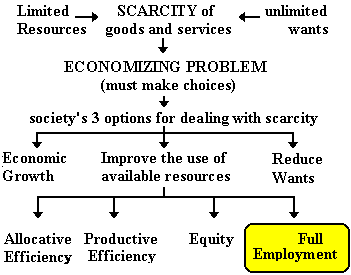
The primary reason to study unemployment is that it contributes to scarcity. Scarcity always exists since resources are limited and human wants are unlimited. There are five ways to reduce scarcity - the five Es of economics (see diagram below). Full employment is one of the five Es. If a society uses ALL AVAILABLE RESOURCES then more goods and services will be produced and scarcity will be reduced
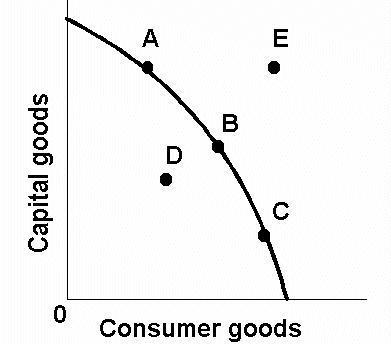
Another way to illustrate the effects of unemployed resources is with the production possibilities curve (see graph below). Point "D" illustrates the effect of unemployment. Points "A", "B", and "C" represent the maximum possible levels of production WITH FULL EMPLOYMENT. With unemployment, less will be produced (point "D").
Finally, we have illustrated unemployment before using the AS-AD model.
If the equilibrium level of output is less than the full employment level as illustrated on the graph above, this indicates that some available resources are unemployed.
Unemployment
OPTIONAL:
From where do the statistics come?
[From http://stats.bls.gov/cps_faq.htm]
Because unemployment insurance records, which many people think are the source of total unemployment data, relate only to persons who have applied for such benefits, and since it is impractical to actually count every unemployed person each month, the Government conducts a monthly sample survey called the Current Population Survey (CPS) to measure the extent of unemployment in the country. The CPS has been conducted in the United States every month since 1940 when it began as a Work Projects Administration project. It has been expanded and modified several times since then. As explained later, the CPS estimates, beginning in 1994, reflect the results of a major redesign of the survey.
The Unemployment Rate
http://www.cbs.nl/en/figures/keyfigures/sip_600z.htm
As of September 2000, the US unemployment rate is 3.9%
What is Unemployment?
Definition
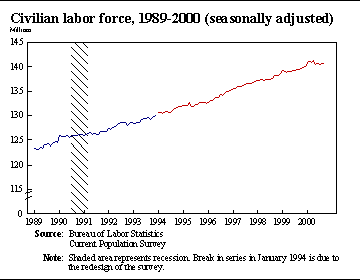
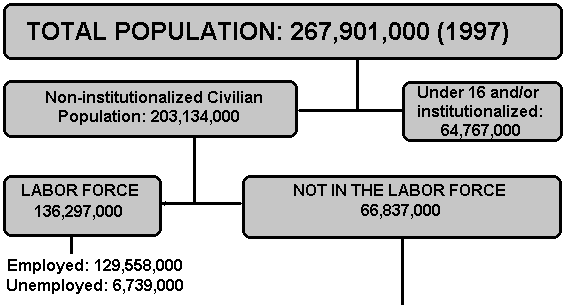
If the unemployment rate is 3.9%, then 3.9% OF WHAT are unemployed? It is NOT 3.9% of the population, but rather 3.9% of the LABOR FORCE.
What is the labor force?
[From http://stats.bls.gov/cps_faq.htm]
The basic concepts involved in identifying the employed and unemployed are quite simple:
- People with jobs are employed.
- People who are jobless, looking for jobs, and available for work are unemployed.
- People who are neither employed nor unemployed are not in the labor force.
Who is counted as employed?
[From http://stats.bls.gov/cps_faq.htm]
Not all of the wide range of job situations in the American economy fit neatly into a given category. For example, people are considered employed if they did any work at all for pay or profit during the survey week. This includes all part-time and temporary work, as well as regular full-time year-round employment. Persons also are counted as employed if they have a job at which they did not work during the survey week because they were:
- On vacation;
- Ill;
- Experiencing child-care problems;
- Taking care of some other family or personal obligation;
- On maternity or paternity leave;
- Involved in an industrial dispute; or
- Prevented from working by bad weather
Who is counted as unemployed?
[From http://stats.bls.gov/cps_faq.htm]
Persons are classified as unemployed if they do not have a job, have actively looked for work in the prior 4 weeks, and are currently available for work.
Who is not in the labor force?
[From http://stats.bls.gov/cps_faq.htm]
All members of the civilian noninstitutional population are eligible for inclusion in the labor force, and those 16 and over who have a job or are actively looking for one are so classified. All others--those who have no job and are not looking for one--are counted as "not in the labor force." Many who do not participate in the labor force are going to school or are retired. Family responsibilities keep others out of the labor force. Still others have a physical or mental disability which prevents them from participating in labor force activities.
|
"Employed" includes:
|
|
Unemployed persons are:
[From http://stats.bls.gov/cps_faq.htm]
What Is "Full Employment"?
As we discussed above full employment results in reducing scarcity
by producing the economy's potential level of output. The current
unemployment rate (Sept. 2000) is 3.9%, that amounts to
5,477,000 people. THIS IS FULL EMPLOYMENT!!
How can 3.9% unemployment be considered full employment?
It depends on how we define full employment. We will define full employment as using all available resources so as to achieve the potential level of output for an economy. Full employment is achieving the potential level of output.
Achieving the potential output
As we learned in our AS-AD lesson this is NOT the absolute maximum, but it is the potential level of output under normal circumstancesGraphically, potential, or full employment output can be illustrated two ways:
1) Points A, B, and C on the production possibilities curve represent a full employment of resources.
2) Equilibrium on the AD - AS graph below is at the full employment level of output.
Types of Unemployment
To understand how we can achieve the potential level of output and still have 3.9 % unemployment we must understand the three types, or causes, of unemployment. The key to understanding what full employment means, is to consider what happens to output with each type of unemployment.
1. frictional unemploymentREAD: http://william-king.www.drexel.edu/top/prin/txt/probs/Ch5_fricUnN.html2. structural unemployment
READ: http://william-king.www.drexel.edu/top/prin/txt/probs/strunN.html3. cyclical unemployment -- business cycle
READ: http://william-king.www.drexel.edu/top/prin/txt/probs/cycunN.html
The Full Employment Rate of Unemployment
Economists assume that about 5% (probably less now) is Full Employment. This is called the "full employment rate of unemployment", or the "natural rate of unemployment" and it includes the frictional unemployment and the structural unemployment, but no cyclical unemployment. In other words, full employment is zero cyclical unemployment.
If there is some frictional and structural unemployment in the economy can the potential level of output still be achieved? YES, and economists estimate that there is between 4% and 5% frictional and structural unemployment in the US economy. that is why we are currently at, or below, full employment.
Why?
Frictional Unemployment and Potential Output
First, frictional unemployment is NECESSARY in order for the economy is to achieve its potential level of output. For example, let's assume an engineering student has just graduated from college and is looking for a job. He/she is frictionally unemployed. Would society's scarcity be reduced as much as possible if that engineer takes the first job he/she finds? On the way home from graduation he/she sees a "HELP WANTED" sign, turns in, applies, and works the rest of his/her life at McDonald's. Is this good for society? OR would it be better for society if they NOT take that job at McDonald's and remain frictionally unemployed longer? We need some frictional unemployment to get resources to the jobs where they produce the most. To produce as much as possible with our limited resources we need some frictional unemployment.
Frictional unemployment tends to be short-lived, BUT we do not want it to last too long. If that engineer is unemployed for many years looking for just the right job, then there would be more scarcity than if he/she had taken the job at McDonald's. Therefore programs to keep it low would help reduce scarcity and governments have such programs: state employment offices and career placement offices at universities.
Structural Unemployment and Potential Output
Second, structural unemployment results form people not having the necessary skills. If these people are unemployed, what happens to scarcity? Nothing, because they don't have the skills needed. Therefore we can still produce our potential level of output with our available resources even if there is structural unemployment. If resources without skills were put to work, they, by definition, couldn't produce anything because they don't have the skills.
But, do we want these workers to just do nothing? NO. We studied in the 5Es lesson that more workers or better workers results in economic growth. Economic growth is increasing out potential level of output. this is good for society since it also reduces scarcity. therefore governments have economic growth programs to reduce structural unemployment like financial aid for school and job training programs.
Cyclical Unemployment and Potential Output
If there is a recession and therefore an increase in unemployment associated with a decrease in output, this results in more scarcity. This is not good for society since it will be producing at a point inside its production possibilities curve (point D on the graph below) or at a level of output short of the full employment level.
|
|
|
Therefore, governments have policies to reduce cyclical unemployment. These are the demand management policies discussed in our lesson on the AS-AD Model: expansionary fiscal policies and easy money policies.
Changes in the Full Employment (Natural) Rate of Unemployment
Costs of Unemployment
Read: http://bized.ac.uk/virtual/economy/policy/outcomes/unemployment/unempth1.htm
GDP gap
As we have discussed many times, the problem with unemployed resources is that they could have been used to produce more boats - - or cars or whatever it is that society wants. with unemployment there is more SCARCITY. This loss of goods that could have been produced if we had used all of our resources is called the GDP gap and it is a measure of the cost of unemployment.
One way to measure this cost is with Okun's Law>
[the following is from Brad deLong:
http://www.j-bradford-delong.net/Teaching_Folder/Econ_100b_S96/Lectures/lecturefour.html
Arthur Okun--Chairman of the Council of Economic Advisers under President Johnson in the 1960s--noticed a striking statistical regularity: every one percentage point decrease in the unemployment rate seemed to be associated with a 2-3 percent increase in output relative to the economy's long-run potential growth path.At first thought, this is kind of odd. A one percentage point decrease in the unemployment rate seems like it ought to be more-or-less a one percent increase in the number of workers. So we would expect output to grow by at most one percent (maybe less if the new workers cannot find sufficient capital goods to boost their productivity up to the level of the previously-employed).
Instead we find--consistently--output growing by 2-3 percent.
The solution?
When the unemployment rate falls by one percentage point, the labor force rises by about one percent--discouraged workers re-enter the labor force.
Hence a one percentage point fall in the unemployment rate is associated with approximately a 1.5 percent rise in the number of workers.
A one percentage point fall in the unemployment rate is associated with an 0.5 percent increase in the length of the average workweek.
And--perhaps--a one percentage point fall in the unemployment rate is associated with an 0.5 percent increase in average labor productivity. Production processes seem to work more smoothly--less downtime, less waiting around, more efficient use of fixed distributional resources, a whole bunch of things that you can label increasing returns to scale.
Unequal Burdens
a. occupation
b. age
c. race
d. gender
e. duration
Non Economic Costs
Measuring Inflation
A. Definition: Inflation is a rising general level of prices (not all prices rise at the same rate, and some may fall).B. To measure inflation, subtract last year’s price index from this year’s price index and divide by last year’s index; then multiply by 100 to express as a percentage.
C. "Rule of 70" permits quick calculation of the time it takes the price level to double: Divide 70 by the percentage rate of inflation and the result is the approximate number of years for the price level to double. If the inflation rate is 10 percent, then it will take about ten years for prices to double. (Note: You can also use this rule to calculate how long it takes savings to double at a given compounded interest rate.)
D. Facts of inflation:
1. In the past, deflation has been as much a problem as inflation. For example, the 1930s depression was a period of declining prices and wages.2. All industrial nations have experienced the problem (see Global Perspective 8-2).
3. Some nations experience astronomical rates of inflation (Angola’s was 4,145 percent in 1996).
4. The inside covers of the text contain historical rates for the U.S.
E. Causes and theories of inflation:
1. Demand-pull inflation: Spending increases faster than production. (See Figure 8-7) Inflation will occur in range 2 and range 3 of this illustration. Bottlenecks occur in some industries in range 2, and output cannot expand to meet demand in these industries so producers raise prices; in Range 3 full employment has been reached and resource prices will rise with increasing demand, causing producers to raise prices. Note: Chapter 7’s distinction between nominal and real GDP is helpful here.2. Cost-push or supply-side inflation: Prices rise because of rise in per-unit production costs
(Unit cost = total input cost/units of output).a. Wage-push can occur as result of union strength.b. Supply shocks may occur with unexpected increases in the price of raw materials.
3. Complexities: It is difficult to distinguish between demand-pull and cost-push causes of inflation, although cost-push will die out in a recession if spending does not also rise.
Price index - review
a. GDP Price Index (GDP deflator) See chapter 7.b. CPI -- consumer price index
"The Consumer Price Index (CPI) is a measure of the average change in price over time in a fixed market basket of goods and services bought by consumers for day-to-day living. The All Items CPI for the U.S. is the broadest, most comprehensive index, and is often quoted as the source for the "rate of inflation". The CPI for All Items less Food and Energy (also sometimes referred to as the "core" or "underlying" CPI) excludes volatile food and energy prices. Some analysts use this index to track long-term trends in prices. " [from http://stats.bls.gov/wh/cpibrief.htm]
READ THE FOLLOWING THEN CLICK ON
AND LISTEN TO THE 5 MINUTE RADIO REPORT ON THE CPI
All Things Considered
National Public Radio
Wed., July 19, 2006"Shopping for the Consumer Price Index"
http://www.npr.org/templates/story/story.php?storyId=5568606
All Things Considered, July 19, 2006 · The Bureau of Labor Statistics today released the monthly Consumer Price Index, a key economic indicator that tracks inflation. To track prices, the Labor Department sends out hundreds of people around the country to monitor prices for everything Americans buy -- from tires to food and college tuitions.
Robert Siegel went shopping with Caren Gaffney to find out how the Consumer Price Index is compiled. On the outing, Gaffney, a former telecommunications executive, checked prices in two grocery stores in the Washington, D.C., area. Siegel discusses the index with economists Mark Zandy of Moody's Economy.com, the Cleveland Federal Reserve's Michael Bryan and the University of Rochester's Mark Bils.
Year
Annual
1976
56.9
1977
60.6
1978
65.2
1979
72.6
1980
82.4
1981
90.9
1982
96.5
1983
99.6
1984
103.9
1985
107.6
1986
109.6
1987
113.6
1988
118.3
1989
124.0
1990
130.7
1991
136.2
1992
140.3
1993
144.5
1994
148.2
1995
152.4
1996
156.9
1997
160.5
1998
163.0
1999
166.6
OPTIONAL- More info. on the CPI: http://stats.bls.gov/cpifaq.htm
OPTIONAL - how the CPI is measured: http://stats.bls.gov/cpifact2.htm
OPTIONAL: CPI TABLE
Calculating Inflation - - - - KNOW THIS !!!!!!
Since a price index measures the price level as a percent of a base year and inflation measures the change in the price index from the previous year, to calculate the inflation rate we use the following formula:
Inflation rt. for current year =
x 100
So to calculate the inflation rate for 1999 using the CPI data above:
Inflation rate for 1999 =
x 100
Inflation rate for 1999 =
x 100 = 2.2 %
For fun try these online inflation calculators:
The Rule of 70 - - - - KNOW THIS !!!!!!
The rule of 70 is a quick way to estimate how long it will take for something (like prices) to double if you know the annual percentage increase (like inflation).
|
|
|
|
approximate number of years to double = |
|
|
|
For example, if the inflation rate is 3%, it will take 23 1/3 years for prices to double.
|
|
|||
|
approx. number of years to double = |
|
= |
23.33 years |
|
|
This handy little rule can be used for many things.
If the population of a country is growing at a rate of 1% a year, how many years until the population doubles?
|
|
|||
|
approx. number of years to double = |
|
= |
70 years |
|
|
What if the population growth rate is 4 % a year?
|
|
|||
|
approx. number of years to double = |
|
= |
17.5 years |
|
|
Causes / Theories of Inflation
Demand-Pull inflation
 Demand-pull inflation is inflation caused by too much spending (and increase in AD).
Cost-push (supply-side) inflation
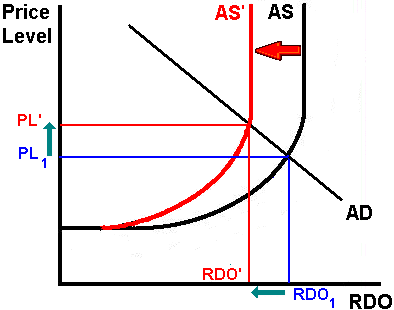 Cost-push inflation is inflation caused by a decrease in AS often the result of higher resource costs.
Effects of Inflation
Redistributive effects of inflation:
2. Many families are simultaneously helped and hurt by inflation because they are both borrowers and earners and savers.
3. Effects of inflation are arbitrary, regardless of society’s goals.
Output Effects of Inflation
A. Cost-push inflation, where resource prices rise unexpectedly, could cause both output and employment to decline. Real income falls.B. Mild inflation (<3%) has uncertain effects. It may be a healthy by-product of a prosperous economy, or it may have an undesirable impact on real income.
C. Danger of creeping inflation turning into hyperinflation, which can cause speculation, reckless spending, and more inflation (see examples in text of Hungary and Japan following World War II, and Germany following World War I).
|
OPTIONAL:
|