Welcome to ECO 212
Macroeconomics in the Global Economy
|
http://www.youtube.com/watch?v=VVp8UGjECt4
Brief Outline:
- Introduction to ECO 212
- Why "Macroeconomics in the Global Economy"?
- The 5 E's of Economics
- Economic Growth
- Productive Efficiency
- Productive Efficiency
- Equity
- Full Employment
- What is MACROECONOMICS?
- Why Study Economics?
- The Use of Theories and Graphs in Economics
- Benefit Cost Analysis
- The Economizing Problem: Making Choices
- Limited Resources: The Four Factors of
Production
- Production Possibilities Frontier (Curve)
- Demonstrating the Necessity of Choice --
- Opportunity costs
- Law of Increasing Costs
- Unemployment
- Productive Inefficiency
- Economic Growth
- Present Choices and Future Possibilities
- International trade
- Marginal Analysis - How to make choices
1a Introduction to the Course
|
Introduction to ECO 212
Syllabus and Webpage:
- Mac Web App - put an icon on your mobile device
- roster
- Read the syllabus and take online syllabus quiz (5
points).
- Blackboard:
- Go to http://harper.blackboard.com
- Follow the instructions to "log-in",
- If you need help see the following on the Blackboard
opening page:
- "Getting Started with Blackboard"
- "Student Blackboard Technical Support"
- You should see our course listed under the "My Blackboard"
tab
- If you do not please e-mail the instructor:
mhealy@harpercollege.edu
- On Blackboard you will find:
COURSE INFO.
BEFORE CLASS
DURING CLASS
AFTER CLASS
FOR POINTS
OTHER
COURSE INFO.
- WELCOME EMAIL
- ANNOUNCEMENTS
- SYLLABUS
- SCHEDULE
- OFFICE HOURS
- FACULTY INFO.
BEFORE CLASS
- LESSONS
- PREQUIZZES
- VIDEO LOGIN
- MAC WEB APP
- Chapter 23W - 16th ed.
- Micro Ch. 16 - 19th ed.
- Ch. 22W, 19th ed.
DURING CLASS
- YELLOW PAGES
- LECTURE OUTLINES
- CLICKER QUIZZES
AFTER CLASS
- REQUIRED ACTIVITIES
- PRACTICE EXERCISES
- REVIEW QUIZZES
- FINAL EXAM REVIEW
- BUY STUDY GUIDE
- TEXTBOOK SOLUTIONS
- Answers to Key QuestionsThis link is hidden from
students
FOR POINTS
- SYLLABUS QUIZ
- PREQUIZZES
- REQUIRED ACTIVITIES
- PAPERS
- EXTRA CREDIT
OTHER
- ONLINE LECTURES
- DISCUSSION BOARD
- MY GRADES
- TEXTBOOK WEBSITE
- Option to Forward E-mail from your Harper Email Account
If you are not planning on using your Harper email account, you
can find instructions on how to forward email from that account to
one you check frequently by logging in to the Harper Student
Portal and clicking on the "My Harper E-Mail" tab. All
correspondence in this class will be sent to your Harper e-mail
account.
If you need further assistance, contact the Student Service
Desk at 847-925-6866, or email: studentsd@harpercollege.edu.
When e-mailing your instructor always put "ECO 212" and a
message in the subject line of all e-mails sent to the instructor.
Please use proper spelling, punctuation, and grammar.
- Syllabus :http://www.harpercollege.edu/mhealy/eco212/syllabus/macsylsi.htm
- Course Materials (This information is found on the
syllabus)
Brief list:
- Required Textbook: Macroeconomic by
Campbell R. McConnell, Brue, and Flynn, 19th edition,
McGraw-Hill, 2012 (Be sure to get the 19th
edition.)
- Required Online Videos: Tomlinson Videos on
Thinkwell
- Required Yellow Pages, (Free, distributed in class
and available on our Blackboard site)
- Mac Web App: An app for your cell phone or
tablet
- Recommended Textbook Study Guide: Study Guide
For Macroeconomics, McConnell/Brue/Walstad, 19th
edition, McGraw-Hill, 2012
REQUIRED:
|
TEXTBOOK: Macroeconomics by Campbell
R. McConnell, Brue, and Flynn, 19th edition, McGraw-Hill,
2012
Just the textbook. No textbook access codes. No
"Connect". NOTE: be sure to get the 19th
edition even though there is a 20th edition
available
|
REQUIRED:

|
Tomlinson Videos on ThinkWell
BUYING the Tomlinson Videos on ThinkWell
(Once you log in to the Thinkwell class site
click on the "Chapter Checklist" link for a list
of the videos by their number.)
- Go to: http://www.thinkwell.com
- Click on "Register" in the upper right corner

- In the "Classroom and Distance Learning" area use
the pull-down menu to select your state:
"Illinois"
- Use the pull-down menu to select your school:
"Harper College"
- Use the pull-down menu to select your class:
- Click on

- Then click on Checkout
 to purchase for $49.
- Follow the instructions to enter the required
fields.
- Next time you go to Thinkwell.com click on the
"Sign In" button to enter your username and
Password.
USING the Tomlinson Videos on Thinkwell:
- VIDEO
LOGIN is a link to sign into the Tomlinson video
lectures that you must purchase online. Assigned video
lectures are listed on the LESSONS
page with a numbering system that looks like: 1.1.1,
1.1-2, 2.1.1, etc.
- Once you log in to the Thinkwell class site
click on the "Chapter Checklist" link for a
list of the videos by their number.
- Note that each video can be watched FULL
SCREEN.
- Also, for each video you will have access to a
"Thinkwell Excercise" of from six to fifteen multiple
choice review questions, as well as Video Transcripts.
The exercises are quite useful.
Finally, you will want to have the VIDEO
NOTES handy when you are watching the videos
|
REQUIRED:
|
The Yellow Pages are packet of worksheets. We will do
many of the graphing exercises in class and some of the
Quick Quizzes. You will not get points for doing them,
but I think you will find them very useful while you
prepare for the quizzes and exams.
The Yellow Pages are available to you for free in
class or on our Blackboard site. Answers to the Yellow
Pages are also available on Blackboard. Make sure you
CHECK YOUR ANSWERS.
|
USEFUL:

|
MAC WEB APP:
The MacWebApp
has all of the information found on our LESSONS
page.
How to put an icon to the app on the homescreen of
your mobile device:
- On your cell phone or tablet go to the MacWebApp
home page (http://www.harpercollege.edu/mhealy/eco212/macwebapp/macwebapp.htm).
- Android: Launch Chrome for Android and open
the website or web page you want to pin to your home
screen. Tap the menu button and tap Add to homescreen.
You’ll be able to enter a name for the shortcut
and then Chrome will add it to your home screen.
- iPhone, iPad, & iPod Touch: Launch the
Safari browser on Apple’s iOS and navigate to the
website or web page you want to add to your home
screen. Tap the Share button on the browser’s
toolbar — that’s the rectangle with an arrow
pointing upward. It’s on the bar at the top of
the screen on an iPad, and on the bar at the bottom of
the screen on an iPhone or iPod Touch. Tap the Add to
Home Screen icon in the Share menu.
The app is not designed to replace your textbook,
computer, or paper and pencil. To learn the class
material you will have to read the textbook, watch the
Tomlinson video lectures, and DO PROBLEMS. When doing
problems you will need to use pencil and paper.
The app is designed to allow you to to do a
quick review after you have studied the
material.
The app is organized according our twenty-five
lessons. For each lesson you will usually find a quick
introduction, an interesting topic, the reading and video
assignments, key term flashcards, a quick review quiz,
key graphs, and YouTube review videos.
Be sure to put an icon to the app on your mobile
devices !!!
|
RECOMMENDED:
|
Study Guide For Macroeconomics,
McConnell/Brue/Walstad, 19th edition, McGraw-Hill,
2012
Printed:
- Can be bought online for less than
$20. Go to your favorite book site or search for:
ISBN 9780077337964
or
- The Study Guide can be bought at the Harper
College Bookstore (L building) or online at:
http://www.harperstore.com
- ISBN 9780077337964
- Cost about $65 new, $40 used, plus tax
Online:
- The Study Guide is also available in an online
version for only $15:
- To Purchase:
- Click on "I am a Student"
- Then, in the right column you can buy the
online version of the Study Guide by clicking on

- A USED PRINTED STUDY GUIDE can be bought
online for less than $15
|
OUTLINE -- CHAPTER 1
Limits, Alternatives, and Choices:
An introduction to Economics and the 5Es
I. Introduction to Macroeconomics in the Global Economy - Day
1
A. ACTIVITY:
|
QUESTION (use clickers):
Should the United States have free
trade with Mexico?
A. Yes
B. No
It Depends . . . .
- What GOAL are we trying to
achieve?
|
|
QUESTION (use clickers:
Assume that a hurricane has struck the
coast of Florida causing massive destruction. As a
result, the prices of many products like hotel
rooms, water, plywood, etc. increase significantly.
For example, let's say the price of plywood
increases from a price of $10 a sheet before the
hurricane to $30 a sheet after the hurricane.
What should the government do?
A. Pass a law to make these
"price-gouging" increases illegal returning the
price to $ 10
B. Nothing. Let the price of plywood rise
to $30 or more
C. Something else?
Again: What is the GOAL?
|
|
OTHER:
- Why the price of gasoline in the United States
is TOO LOW (we may have to wait until after we
finish chapter 5 to truly understand this.)
- Why it is GOOD when companies "outsource" (or
move) jobs to Japan and other countries (again, we
may not really understand this right away but we
should after chapter 20).
|
B. Why "the Global Economy"?
Welcome to ECO 212
Macroeconomics in the Global
Economy
|
1. Who has taken a MICROeconomics course (ECO
211)?
- no prerequisite
- need to review of microeconomic principles
- we'll do so, but in an international context
2. The three issues of Macroeconomics (ECO 212)
a. Unemployment (UE)
b. Inflation (IN)
c. Economic Growth (EG)
3. Global Economics is "in the news" BUT . . .
Dobbs: New Congress must show courage
[http://www.cnn.com/2006/US/11/28/Dobbs.Nov29/index.html]
Lou Dobbs, former CNN News commentator, says:
"We've lost three million manufacturing jobs as a result
of these so-called free trade agreements that enable
corporate America to export plants, production and jobs to
cheap foreign labor markets."
Then read the following quotes taken from our
textbook:
"The long-run impact of tariffs (restricting trade) is
not an increase in employment . . . (p. 489) "
" tariffs also reduce efficiency and the world's real
output" (p. 487)
4. Structural Adjustment and Globalization
C. Structural Adjustment - two examples
1. Microeconomic Example: Agriculture in China
http://www.npr.org/blogs/money/2012/01/20/145360447/the-secret-document-that-transformed-china
2. Macroeconomic Example - Video: Korea vs. Sri
Lanka
While watching the video look for answers to
these questions:
1. What are they doing? (POLICIES)
2. Why are they doing it? (BENEFITS)
3. What negative effects might arise? (COSTS)
|
To watch 5 minute video:
- Click on: http://www.learner.org/resources/series86.html
- Scroll down to:
- 10. Developing Countries - How these
nations have been helped or hurt by the rapid
growth since WWII. Case studies: comparing
South Korea and Sri Lanka; aid vs. trade in
Tanzania.
- Click on
 (A free
registration may be required)
(A free
registration may be required)
- Then slide the timer to minute 7:45 for the
eight minute South Korea vs. Sri Lanka case
study
|
- Cuba Examines Asian Model For Economic
Reforms (NPR Morning Edition)
|
3. News Articles:
- Some people oppose Structural Adjustment / Free
Trade
- But most economists, political leaders and people (?)
support SAPs
D. Why?
- Why are countries all over the world undertaking
Structural Adjustment Programs (SAPs)?
- To answer this we need to:
- Understand the GOAL of Economics
- Learn the 5 Es of Economics
- Learn some fundamental economic
principles
- That is what we will be doing in unit 1
- Cuba Examines Asian Model For Economic
Reforms (NPR Morning Edition)
|
II. Short Introduction to Structural Adjustment
Programs
A. Introduction
B. Economic Systems
C. Structural Adjustment Policies
VIDEO: Poland
- Privatization
- Promotion of Competition
- Reduced Role of Government
- Removing Price Controls
- Freer Trade and Convertible Currency
- Foreign Investment
- Other
|
Available online at:
- Click on: http://www.learner.org/resources/series86.html
- Scroll down to:
- 11. Economies in Transition: Transforming
former Communist countries into market
economies. Case studies: state industries vs.
private entrepreneurs in Russia; the success of
Poland’s “shock therapy.”
- Click on
(A free
registration is required for first time
users)
- Then slide the timer to minute 27:25 for the
eight minute the success of Poland’s
“shock therapy case study
|
D. Goals of SAPs
- Maximize society's satisfaction = improve the
standard of living
- Macroeconomic Goals:
- full employment
- low inflation
- economic growth
E. Problems with SAPs:
- initial inflation and unemployment
- initial falling output and living standards
- inequality and social costs - some people are worse
off
1b The 5Es of Economics (or How to Reduce Scarcity)
|
REVIEW: Why Globalization? Listen How
Are People In Europe Reacting To Trump's Rhetoric?
[NPR Morning Edition, Jan. 23, 2017, 5:47]
PREVIEW:
- Why the price of gasoline in the United States is TOO LOW
(we may have to wait until after we finish chapter 5 to truly
understand this.)
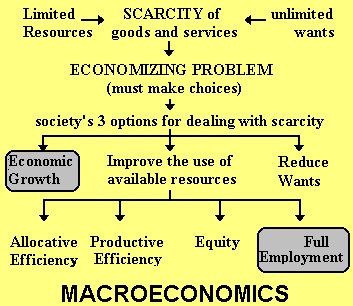
III. The Economic Perspective: Scarcity and
Choice -- the 5Es of Economics
A. Scarcity -- Limited resources and Unlimited
wants
- The reason why we have to make
choices
- economic definitions are sometimes different - define
"scarcity"
- "erskinite"
B. Unlimited Wants and the necessity of choice
C. Solving the Economizing Problem: Options for Dealing with
Scarcity
1. economic growth ( the first "E")
2. reducing wants
3. use existing resources wisely = maximizing satisfaction
1. economic growth ( the first "E")
a. DEFINITION: an increase in the ABILITY to
produce goods and services
[This is NOT the same as the common definition: an
increase in output]
b. caused by:
- MORE resources
- better resources
- better technology
c. textbook:
"An
outward shift in the production possibilities curve which
results from an increase in resource quantity or quality or
an improvement in technology"
(more on this later)
d. Economic growth is one of the three issues of
Macroeconomics --We'll discuss economic growth in more
detail later in this chapter, in unit 2, and throughout the
semester.
2. reducing wants
3. use existing resources wisely = maximizing
satisfaction
IV. Maximizing Satisfaction -- Four More
Es
- Maximizing satisfaction from EXISTING resources
- The goal of SAPs
[StrucAdjDef]
- 5Es
A. Productive Efficiency
B. Allocative Efficiency
- 1. definition
2. How does this MAXIMIZE SOCIETY'S SATISFACTION and
REDUCE SCARCITY?
3. examples
- a. steel: horseshoes or cars
b. crude oil: gasoline or kerosene
c. small cars or SUVs
4. Allocative inefficiency
5. The role of prices in achieving allocative
efficiency
C. Equity
D. Full Employment
|
F. Review
1. What is Structural
Adjustment?
2. Why are they doing
it?
a. What is
Economics?
b. What is the
GOAL?
c. What are the
5Es?
d. How does EACH of the 5Es
reduce scarcity and achieve this
goal?
3. Compare market economies and
command economies as to how well they achieve the
5Es.
|
Lesson 1c: Making Choices: Production Possibilities
Curve (PPC) and Benefit Cost Analysis
|
V. What Is Economics?
A. Need to know basic economic principles to
understand WHY the world is moving toward Structural Adjustment or
Globalization
B. DEFINITION:
1. MARK'S
DEFINITION OF ECONOMICS:
2. TEXTBOOK'S DEFINITION : Economics is the social
science concerned with how individuals, institutions, and
society make optimal (best) choices under conditions of
scarcity.
- What I like: The emphasis on making
CHOICES
- What is unclear: What does "SCARCITY" mean?
- GOAL OF ECONOMICS: BEST CHOICES = Maximize
Satisfaction !
3. OUR DEFINITION: Economics is the social science
that studies how we choose to use limited
resources to obtain the maximum satisfaction of
unlimited human wants
C. The definition has 4 parts:
- social science
- choice
- scarcity
- maximizing satisfaction
VI. "Social Science" -- Using theories
A. based on facts
B. simplifications
C. generalizations
D. abstractions
E. ceteris paribus
VII. Why Study Economics
VIII. Limited Resources: The Four Factors of
Production
A. What is a resource?
B. Types of Resources
1. Land
a. examples
b. definition
2. Capital
a. examples
b. definition
3. Labor
a. examples
b. definition
4. Entrepreneurial Ability
a. examples
b. definition
C. Resource
Quiz (yellow page)
D. Resources and Resource Payments
1. land -- rent
2. capital -- interest
3. labor -- wages
4. entrepreneurial ability -- profits or losses
IX. Economic Models
A. Demonstrating economic concepts
B. Line Graphs
1. construction
2. inverse and direct relationships
3. slope
a. linear (straight) graph
b. nonlinear (bent) graph
X. MAKING CHOICES - WHY? - The
Necessity of Choice -- Production Possibilities
A. Society's Economizing Problem -- The
Necessity of Choice
The
choices necessitated because society’s material wants for
goods and services are unlimited but the resources available to
satisfy these wants are limited.
1. Unlimited Wants
2. Limited resources
B. Production Possibilities -- Demonstrating the Necessity
of Choice
|
The Production Possibilities Curve can be use to
illustrate several important economic
concepts:
- we must make choices
- choices have opportunity costs
- the law of increasing costs
- the effect of unemployment
- the effect of productive
inefficiency
- the effect of economic growth
- how present choices affect future
possibilities
- it does NOT show the optimum product mix
(allocative efficiency)
|
1. Production
Possibilities Table
a. shows the MAXIMUM POSSIBLE LEVELS OF
PRODUCTION given the assumptions
b. assumptions
- fixed resources
- fixed technology
- productive efficiency
- full employment
- only two goods
3) the necessity of choice -- Unattainable
combinations
2. Production Possibilities Curve
a. the necessity of choice -- Unattainable
combinations
b. opportunity costs
1) ALL costs in economics are opportunity
costs
2) definition
The
amount of other products which must be forgone or
sacrificed to produce a unit of a product.
3) examples
- op. cost of coming to class today
- op. cost of attending NIU
- op. cost of a free trip to Europe
- What is the op. cost of a human life?
4) calculating opportunity costs
c. law of increasing costs
1) definition
As
the production of a good increases the opportunity
cost of producing an additional unit rises.
2) shape of the PPC -- concave
3) rationale
d. unemployment
e. productive inefficiency
f. economic growth (Macro Issue)
1) Two (Three) Definitions
- Increasing our ABILITY to Produce = INCREASING
OUR POTENTIAL (Ch. 1 / 5Es Def.)
- Increasing Output = ACHIEVING OUR POTENTIAL
(Ch. 8 Def. ?)
- graphically
- reduce UE
- reduce. prod ineff.
- GDP per capita (Ch. 8 Def.)
2) a
shrinking PPC?
3) non-proportional growth
g. present choices, future possibilities
h. optimum product mix? (allocative efficiency?)
C. Real World Applications of the
PPC
1. The economics of War (p. 14)
- defense good, civilian goods and the "war on
terror"
- Marginal Benefit and Marginal Costs
- 9/11 increase the MB of defense goods
2. discrimination
3. growth: Japan vs. U.S.
4. international trade
XI. MAKING CHOICES - HOW? - The Necessity of
Choice -- Benefit Cost Analysis: How to make choices
p. 5, Fast Food Lines (box)
p. 5, "Marginal Analysis: Benefits and Costs"
pp. 13-14, "Optimal Allocation" (especially fig 1.3),
p. 14 "The Economics of War" (box)
A. Benefit-Cost Analysis
"the economic perspective")
1. definition
the selection of ALL possible alternatives where
the marginal benefits are greater than the marginal cost
select all where: MB > MC
up to where: MB = MC
but never where: MB < MC
TEXTBOOK: Marginal Analysis:
the comparison of marginal ("extra" or "additional")
benefits and marginal costs, usually for decision making
.
2. marginal benefits and marginal costs
marginal benefit
The extra (additional)
benefit of consuming one more unit of some good or service;
the change in total benefit when one more unit is
consumed.
marginal
cost
The extra (additional) cost
of producing one more unit of output; equal to the change in
total cost divided by the change in output (and in the short
run to the change in total variable cost divided by the
change in output).
3. Marginal
Benefit = Marginal Cost Rule
- The point
at which the size or scope of production (or any decision)
is optimized.
- The
activity, scope, or output of a project (or decision) should
be increased until it reaches this point - or comes very
close to it.
- This point
will yield the maximum net benefit to society.
- If marginal
benefit exceeds marginal cost, then the project is too
modest, and could be increased thereby increasing the net
benefit to society;
- however, if
the marginal cost exceeds the marginal benefit, then the
project will decrease the net benefit to society and should
be decreased in scope.
- For
example, if the cost of a proposed government program
exceeds its benefits, then it would be unwise to undertake
it, but if the benefits exceed the cost, then it would be
uneconomical, or "wasteful" not to spend on that government
program.
4. ignore fixed or sunk costs
a fixed or sunk cost is any cost that does not
change as a result of the decision
TEXTBOOK: A fixed cost is
any cost which in total does not change when the firm
changes its output; the cost of fixed resources.
5. examples
a. How many guards should be hired?
b. How many bridges should be built?
c. Should I go to class today?
d. should I attend NIU full time?
e. Should I drive fast?
f. The economics of War (p. 14)
defense good, civilian goods and the "war on
terror"
Marginal Benefit and Marginal Costs
9/11 increase the MB of defense goods
g. Sunk costs are irrelevant in decision
making
- buy tickets to football game but wake up with the
flu - should you go?
- you buy "mushy" apples, should you eat
them?
- already paid a nonrefundable annual lease for a
business - should you move to a more profitable
location
- $1 million spent on R&D for a new product that
few people want - should you produce it anyway even at a
loss?
- Pfizer's insulin inhaler
- New Coke
- McLean
- you already bought the ring - should you therefore
marry him/her?
e.Others
Think of a decision that you currently have
to make. What are the marginal benefits and the marginal
costs? Are there any sunk costs that do not matter?
6. GRAPHICALLY
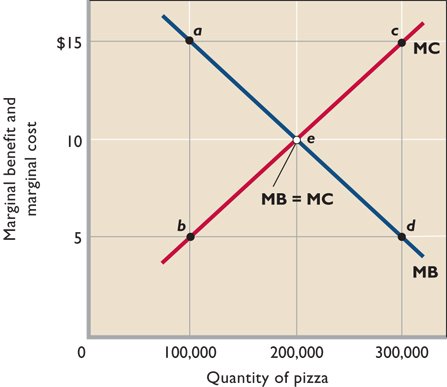
7. REVIEW
a. End-of-chapter questions Chapter 1, #9
Specify and explain the typical shapes of the
marginal-benefit and marginal-cost curves. How are these
curves used to determine the optimal allocation of
resources to a particular product. If current output is
such that marginal cost exceeds marginal benefit, should
more or fewer resources be allocated to this product?
Explain.
ANSWER: The marginal benefit curve is downward
sloping, MB falls as more of a product is consumed
because additional units of a good yield less
satisfaction than previous units. The marginal cost curve
is upward sloping, MC increases as more of a product is
produced since additional units require the use of
increasingly unsuitable resource. The optimal amount of a
particular product occurs where MB equals MC. If MC
exceeds MB, fewer resources should be allocated to this
use. The resources are more valuable in some alternative
use (as reflected in the higher MC) than in this use (as
reflected in the lower MB).
b. Multiple Choice
Problems
|
The following data are for a series of
increasingly extensive flood control
projects:
|
|
|
|
|
Total cost
per year
|
MC
|
Total benefit
per year
|
MB
|
|
No project
|
|
|
$ 0
|
------------
|
$ 0
|
------------
|
|
Plan A
|
levees
|
10,000
|
|
|
20,000
|
|
|
|
Plan B
|
small reservoir
|
24,000
|
|
|
34,000
|
|
|
|
Plan C
|
medium reservoir
|
44,000
|
|
|
42,000
|
|
|
|
Plan D
|
large reservoir
|
72,000
|
|
|
40,000
|
|
|
|
1. Refer to the above data. For Plan D marginal costs
and marginal benefits are:
A. $72,000 and $64,000 respectively.
B. $28,000 and $2,000 respectively.
C. $24,000 and $18,000 respectively.
D. $16,000 and $28,000 respectively.
2. Refer to the above data. On the basis of
benefit-cost (marginal) analysis government should:
A. undertake Plan A.
B. undertake Plan B.
C. undertake Plan C.
D. undertake Plan D.
3. Plan C above entails:
A. marginal benefits in excess of marginal
costs.
B. fewer spillovers than either Plan A or Plan
B.
C. an overallocation (too much) of resources to
flood control
D. an underallocation (too little) of resources to
flood control.
See answers below
ANSWERS:
|
|
|
|
|
Total cost
per year
|
MC
|
Total benefit
per year
|
MB
|
|
No project
|
|
|
$ 0
|
--
|
$ 0
|
--
|
|
Plan A
|
levees
|
10,000
|
10,000
|
20,000
|
20,000
|
|
Plan B
|
small reservoir
|
24,000
|
14,000
|
34,000
|
14,000
|
|
Plan C
|
medium reservoir
|
44,000
|
20,000
|
42,000
|
8,000
|
|
Plan D
|
large reservoir
|
72,000
|
28,000
|
40,000
|
2,000
|
1. For Plan D marginal costs and marginal benefits
are:
B. $28,000 and $2,000 respectively.
Be sure that you can calculate MB and MC.
If you need help ask on the Discussion
Board
2. Refer to the above data. On the basis of
benefit-cost (marginal) analysis government should:
B. undertake Plan B.
Do all options as long as the MB are
greater then the MC (MB>MC)
3. Plan C above entails:
C. an overallocation (too much) of resources
to flood control
For plan C the MB are less than the MC
(MB<MC). this means tat too many resources are
being used on these flood control projects. To say
this another way, IF the MB are less than the MC it
means that you have other uses for these resources
that will give you more benefits. Remember, the MC
of any decision is the benefits of other
alternatives that you are not doing.
XII. The Circular Flow Model
A. The flow
of resources from households to firms and of products from firms
to households. These flows are accompanied by reverse flows of
money from firms to households and from households to
firms.
1. Two Markets
a. product market
A market
in which products are sold by firms and bought by
households.
1) how much to buy
2) how much to produce
b. resource market
A market
in which households sell and firms buy resources or the
services of resources.
1) how many to hire
2) how much we earn
2. Two Flows
a. real flow
b. money flow
3. Reversal of Roles
4. Limitations
B. The Circulr Flow Diagram


