The purpose of these papers is for you to
analyze a news article using the models (graphs) that we have learned
in each unit. This should help you learn to make connections between
theory and reality. This connection, of course, can be made, but it
is not always a smooth one. For each unit you are to find an article
in the popular press. You must make sure you have the right
type of article, as well as an article that provides enough
information. You may want to show your article to the instructor
BEFORE you begin writing. Then you are to ANALYZE the article
using the MODELS (graphs) covered in a particular chapter (or
chapters) in each unit. Do not summarize the article. The purpose of
these papers is for you to demonstrate that you know how to use
the economic models (graphs) to EXPLAIN what is happening in the
news article.
- all papers must be typed, double spaced,
and stapled in the upper left corner
- they should have NO cover page, plastic
covers, etc.
- you must include the article
- on the article you must indicate where
the determinants (papers 1 and 2) or the Fed tool (paper 3) are
discussed. CIRCLE the determinants or tool and LABEL on the
actual article. (i.e. you must write on your
article.)
- The first page of your paper must
include:
- paper title and number
- student's name and CLASS MEETING
TIME
- bibliographical data (where did you get
the article?)
- a TOPIC OUTLINE of your paper
- write your outline first, then write the
paper as you would an English composition with complete sentences,
correct punctuation, etc. The paper must follow your topic
outline.
- all papers MUST be more than one
paragraph
- all papers must contain hand drawn
graphs that show the CHANGES discussed in the
article
- you must discuss the graphs IN THE
PAPER
- you must tell the reader when to refer
to the graphs and explain the graphs
- graphs WILL NOT contain numbered axes,
exact data is not important, we are concerned with
CHANGES
- graphs must be re-drawn on all
rewrites.
- REWRITES - Papers can be rewritten for full
credit with the following restrictions:
- original papers must be turned in by the
due date to earn the chance to be rewritten. Papers can be
turned in late but they cannot be rewritten.
- Rewrites, or original papers, must be
handed in no later than the final date listed on our class
SCHEDULE.
About 3 weeks after the original due date.
- You must hand in all earlier
drafts with your rewrites. Earlier drafts must be stapled
to the BACK of the rewrite.
- Graphs must be re-drawn on all
rewrites
- GRADING: 10 points total, but students will
only receive a 0, 1, 2, 3, or 10. Only an "F" or an "A", so the
chance to rewrite the paper is important.
PAPER 1: SUPPLY AND
DEMAND (Ch. 3)
|
See the "General
Instructions" at the top of this
webpage. You must have a topic outline. See: HOW
TO WRITE AN OUTLINE
Find a news article on an INDIVIDUAL PRODUCT
whose PRICE and/or QUANTITY SOLD has changed. The article should
indicate why the price and/or quantity has changed by
noting which non-price determinants of demand or supply
have changed. The article must mention at least TWO non-price
determinants that have changed. If the article mentions more, then
you must discuss them in your paper as well. If you cannot find an
article that mentions two different determinants then you may use two
different articles that mention only one determinant each, but they
must be different determinants.
SAMPLE ARTICLES:
http://cnn.com/US/9907/27/gas.prices/
http://cnn.com/US/9908/09/rv.boom/
INSTRUCTIONS
Use supply and demand graphs to show changes in
the equilibrium price and/or quantity was caused by the changes in
the non-price determinants. Clearly discuss what happened to the
non-price determinants, what happened to supply and demand, and what
happened to the price and quantity sold of the product as a result.
Explain your graph in your paper. Do not summarize the article.
Write a paper about the graph.
The following are also REQUIRED for paper
1:
- See the "General
Instructions" at the top of this
webpage. You must have a topic outline. See: HOW
TO WRITE AN OUTLINE
- News articles must be printed and stapled
to the back of your paper
- Include bibliographic data. (Where did you
get the article?)
- On the article CIRCLE and LABEL the
statements that indicate that a non-price determinant of supply or
demand has changed. You must write on the article. You must circle
or highlight the sentence or sentences that indicate that a
non-price determinant has changed AND you must write which
determinant it is.
- Your paper MUST include a supply and demand
graph.
- Your graph must show the changes in
demand and/or supply that caused the change in equilibrium
price and quantity. This means that the demand and/or supply
curves must shift.
- The graph must show the change in
equilibrium price and quantity mentioned in the article.
Example: P1, P2, Q1,and Q2.
- In your paper you must say something
like " . . . therefore demand has increased. This will shift
the demand curve to the right. On the graph below you can see
that an increase in demand will shift the demand curve from D1
to D2. As a result, the price of the product will increase
(from P1 to P2) and the quantity will increase (from Q1 to
Q2)."
- If you are discussing one product, then
all changes should be made ON THE SAME GRAPH.
- Hand-drawn graphs, well labeled,
are required.
- On your graph be sure to label the
horizontal axis with the product that you are discussing (for
example "Q of gasoline" or Q of boats"). THIS IS
REQUIRED.
- Supply and demand must be drawn on the
SAME GRAPH with the equilibrium price and quantity clearly
labeled.
Before beginning to look for a news article
and writing your paper:
- read and study chapter 3
- watch the chapter 3 videos
- do the chapter 3 Required Activity and all
of the Yellow Pages for chapter 3
- attend class and take plenty of
notes
- rewrite your notes from class
Purpose of the Paper:
- The purpose of this paper is to show me
that you understand how to use supply and demand graphs to explain
why prices change.
- Do not summarize the article, but rather
explain your graph.
- Let me say this again. Do not summarize the
article. Only use the parts of the article that explain the change
in price and quantity. You should be summarizing the textbook and
class notes to EXPLAIN YOUR GRAPH.
Grading:
- 0/10 means that you did not follow the
instructions and start over (if you handed in your original paper
on time).
- 1/10 means get a new article and start over
(if you handed in your original paper on time).
- 2/10 means that only one determinant was
found in the the article. If you handed your paper in on time you
may get a new article that has two determinants and write another
paper OR use the first article using that one determinant AND find
another article with one more determinant and write another
paper.
- 3/10 means that two or more determinants
were found in the article, but you must rewrite your
analysis
- 10/10 means you are done!
Examples of how you should analyze the
article:
Other Useful and Short
Videos:
PAPER 2: AGGREGATE
SUPPLY and AGGREGATE DEMAND (Ch. 12)
|
Now we will be discussing the WHOLE ECONOMY and we are looking
for changes in unemployment (UE), inflation (IN), and economic growth
(EG). For paper 2 you must find an article that discusses a change in
unemployment, inflation, or economic growth and include at least TWO
non- price level determinantss of aggregate demand and/or aggregate
supply. Clearly explain what changes occurred to these
determinants and what effect these changes had on UE, IN, and
EG. Do this by using AS/AD graphs which show a change in
equilibrium (see textbook figures 12.7 - 12.11 and yellow
pages).
The following are also REQUIRED for paper
2:
- See the "General
Instructions" above. You
must have a topic outline. See: HOW
TO WRITE AN OUTLINE
- Attach a news article
- Before beginning to look for a news
article and writing your paper:
- read and study chapter 12
- do the Required Activities and all of
the yellow pages for chapter 12
- attend class and take plenty of
notes
- rewrite your notes from
class
- Then FIND AN ARTICLE:
- An article on a country that has had
a change in unemployment (UE), Inflation (IN), and economic
growth (EG).
- The article must mention two
DETERMINANTS of aggregate supply (AS) and/or aggregate
demand (AD) that causes the change in UE, IN, and
EG
- In the article CIRCLE the statements
that indicate that a determinant of aggregate supply or
aggregate demand has changed and LABEL the determinant on
the article.
- The news article must be attached to
the back of your paper
- Your paper MUST include a well labeled,
hand-drawn aggregate supply / aggregate demand graph.
- The graph must show the changes in
equilibrium price level and real domestic output (RDO or real
GDP).
- Your graph must show the changes
(shifts) in aggregate demand and/or aggregate supply that
caused the change in equilibrium price level and RDO. This
means that the aggregate demand and/or aggregate supply curves
must shift.
- All changes should be made ON THE SAME
GRAPH.
- EXPLAIN YOUR GRAPH. In your paper you
must say something like " . . . therefore aggregate demand has
increased. This will shift the aggregate demand curve to the
right. On the graph below you can see that an increase in
aggregate demand will shift the curve from AD1 to AD2. As a
result, the price level in the economy of the product will
increase (from PL1 to PL2) and the real domestic output will
increase from RDO1 to RDO2." In other words: EXPLAIN YOUR
GRAPH.
- The purpose of this paper is to show me
that you understand how to use the aggregate supply / aggregate
demand graphs to explain changes in unemployment (UE),
inflation (IN), and economic growth (EG).
- You must use your graph to
explain why UE and IN have changed.
- You must use your graph to
explain changes in EG
- Do not summarize the article, but rather
explain your graph.
- Let me say this again. Do not summarize
the article. Only use the parts of the article that explain the
change changed in aggregate demand and/or agregate supply. You
should be summarizing the textbook and class notes to EXPLAIN
YOUR GRAPH.
Grading:
- 1/10 means get a new article and start over
(if you handed in your original paper on time).
- 2/10 means that only one determinant was
found in the the article. If you handed your paper in on time you
may redo your paper using another article
- 3/10 means that two or more determinants
were found in the article, but you must rewrite your
analysis
- 10/10 means you are done!
Examples of news articles:
Examples of how you should analyze the
article:
Videos that will help you learn how to use
the graphs:
PAPER 3: MONETARY
POLICY (Ch. 16)
|
|
Be sure to see the General
Instructions above. You
must have a topic outline. See: HOW
TO WRITE AN OUTLINE
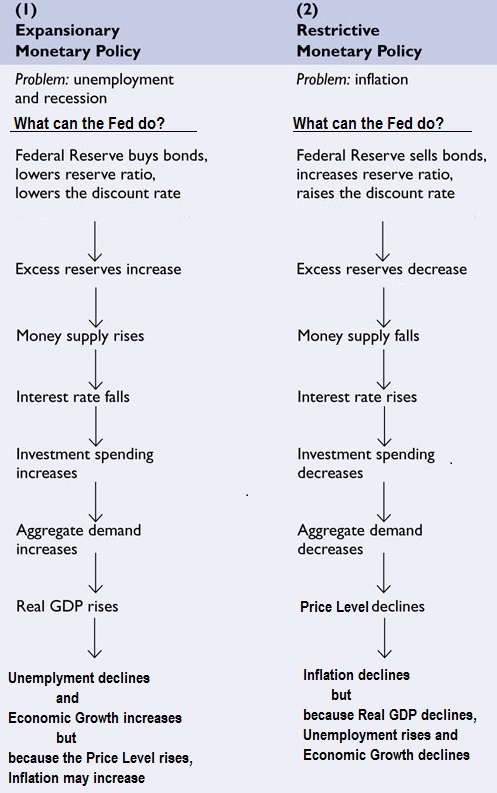
For the third paper you must find a
news article that discusses a change in monetary policy by
the Federal Reserve Board. Often articles will say the "Fed"
changed interest rates. Actually, the Fed has three main
TOOLS that it can use. These tools will change the excess
reserves in the banking system. This will encourage banks to
make more or fewer loans which will affect the money supply.
The change in the money supply will then cause a change in
the interest rates.
Your article must mention WHICH
TOOL the Fed has used to change the money supply. If the
article doesn't mention a tool then we assume that they are
using Open Market Operations (OMO).
The news articles must be printed and
stapled to the back of your paper In the article
CIRCLE the statements that indicate the TOOL used by
the Fed and LABEL the tool used on the
article.
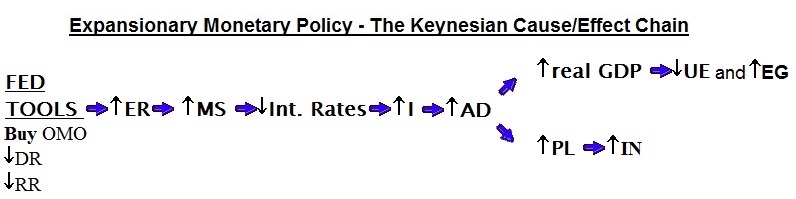
You will use a series of THREE GRAPHS
to show how the use of this tool by the Fed will affect the
economy. (see monetary policy graphs below or in the yellow
pages). You must carefully explain how the use of the FED
TOOL will affect the excess reserves of banks and the money
supply, and then discuss (by explaining the graphs) how this
will affect interest rates, the amount of investment, and
aggregate demand.. THEN you must explain how this change in
aggreage demand will affect UE, IN, and EG. Your AS/AD
graph MUST show the full employment level of real
GDP.
EXPLAIN the GRAPH:
So, if the money supply
decreases you must say "the money supply decreases from
MS1 to MS2". If the interest rates increases you must
say, "interest rates increase from ir1 to ir2". If the
amount of investment decreases you must say, "the amount
of investment decreases from I1 to I2". If agregate
demand decreases, you must say, "aggregate demand
decreases from AD1 to AD2". If the price level decreases
you must say, "the price level decreases from PL1 to
PL2". If the real domestic output decreases you must say,
"real domestic output decreases from RDO1 to
RDO2".
You won't have as much time to write
and rewrite this paper. We will try to cover this material
as soon as we can, but I strongly suggest that you study
ahead and begin early. Below are some YouTube videos that
may help you.
Do not summarize the article, but
rather explain your graph.
Let me say this again. Do not summarize the article.
Only use the parts of the article that discuss the tool that
the Fed is using and what is happening to UE, IN, and EG.
You should be summarizing the textbook and class notes to
EXPLAIN YOUR GRAPH.
The purpose of this paper is to show
me that you understand how to use the the three graph model
to explain how monetary policy (tools) causes changes in
unemployment (UE), inflation (IN), and economic growth (EG).
You must properly explain the cause and effect in the
correct order (see numbers on the graphs
below).
Grading:
- 1/10 means get a new article and
start over (if you handed in your original paper on
time).
- 3/10 means that the article is OK,
but you must rewrite your analysis
- 10/10 means you are
done!
Re-writes:
- You MUST re-draw the three
graphs
- You MUST redo the
outline
- You MUST get the "Cause-Effect"
correct.
- You must include your original
papers stapled to the BACK of your re-write
- Please, read ALL of the
instructions including the PAPER 3 instructions
and the GENERAL INSTRUCTIONS at the top of
this webpage
- Please:
- Watch the VIDEOS
below.
- Study yellow pages 17, 18, and
19.
- Study pages 365-369 (19th,
328-331), table 16.3 on 368 (19th, p. 331), and Figure
16.5 on pp. 366-367 (19th, 328-329).
- What does "Investment" mean?
Please read textbook pages 139 "Consider this . . . ",
154-155, and 226-228, (19th, 120, 133, and
199-200).
|
THE CAUSE-EFFECT
CHAIN
Note the direction of the arrows
indicating what causes what.
SUMMARY - Your MUST
include:
- news article
- outline with proper
notation
- Fed tool CIRCLED and LABELED on
your article
- which TOOL was used and what was
done with it
- how the tool changed excess
reserves (ER) of banks
- thorough discussion of changes on
each of the three graphs with the correct cause and
effect
- the AS/AD graph MUST show the full
employment level of real GDP
- use the AS/AD graph to explain
what happened to UE, IN, and EG.
- What CAUSES what? Be sure to get
the cause/effect order correct. See graphs
below
|
Examples of news articles:
Examples of how you should analyze the
article:
Lesson 16a Key Problem Videos:
Videos that will help you learn how to use
the graphs:
Graphs like those that you will be
using: